Aether Theory and Observations
Involving Ultra Low Frequency Waves
Involving Ultra Low Frequency Waves
2012-2013 Theory and Sensor Details
Release 1.03 03/19/2013
Peter Newton: pwnewton42@yahoo.co.uk
Tony Devencenzi: frostalarm@att.net
2012-2013 Research
Research into Detection of Natural Ultra Low Frequency Phenomena By Peter Newton and Tony Devencenzi
What follows are some of the
experiments we have carried out in detection of naturally occuring ultra low
frequency phenomena, over the past year. Tony lives in
In general, the purpose of the tests
was to detect naturally occuring ultra low frequency electrical and magnetic
phenomena. We also wanted to see the effect our geographical positions had on
the events we detected.
We each have built identical
apparatus, consisting of a sensor circuit, a Velleman VM-110 USB, analog to
digital converter and our PC's running Abacom RealView 3.0 chart recording
software.
Some of our sensors were based on
earlier designs described on the home page of this site, but were improved and
enhanced by our colaborative work during the past year. Additionally, the
Op-Amp Sensor and the Caduceus Coil Sensor, are of new design. Below is a
simple description of the sensors used in this series of tests.
General: The sensors consist of a
sensor element, a conditioning amplifier and a Velleman VM-110 Analog to
Digital converter / USB interface, to connect to a personal computer. The PC is
running Abacom RealView chart recorder software.
In addition to the identical
Velleman VM-110 setups used by both Tony and Peter, in some tests, Peter also
used a Dataq Analog to digital converter with USB interface. This device comes
with its own chart recorder software called Windaq. Some of these charts are
also included with the test result images below.
The Op-Amp Sensor: This sensor
consists of a J-FET Op-Amp IC chip, with a high gain inverting feedback and
open (not connected) inputs. There is a secondary amplifier stage, with a
single stage diode, resistor and filter-capacitor integrator circuit. The
sensor also uses a third amplifier that is part of the Velleman VM-110 USB
interface board, for additional Gain. This sensor is enclosed in a shielded
steel case. This circuit is not operating in self-oscillation, but its output
is the product of a natural daily cycle. For lack of a better explanation, it
is believed that the phenomenon is reacting to, is scalar energy.
The E-Field Sensor: The detector
element, is a simple short telescoping antenna 30 to 60 inches long. There is a
0.1 uF capacitor to ground, at the output of the antenna, to provide a low
resonant frequency and to bypass any RF energy detected. The amplifier is very similar
to the one described in the Op-Amp sensor. Lastly, a dual stage integrator
circuit, integrates the electric activity into a varying DC voltage. This
sensor circuit (except for the Antenna) is enclosed in a shielded steel case.
The Electrolytic Capacitor Sensor:
(Also called the Hodowanec Effect Sensor, after Gregory Hodowanec who first
discovered the ULF sensing capabilities of capacitors). Similar in construction
to the E-Field Sensor, but with a large electrolytic capacitor in place of the
antenna, as the detecting element. The capacitor functions as a detector and
generates a small ultra low frequency voltage, in reaction to the naturally
changing Scalar / Electric ULF field. The detector's amplifier stage functions
the same as the Op-Amp detector amplifier, described above. This sensor circuit
is also enclosed in a shielded steel case.
The Aether-Magnetic Sensor: This
sensor has three detecting or enhancing stages.
First, a Barkhausen detector.
consisting of several hundred turns of copper wire wound around a steel plate
type lamination core assembly, common to transformers and power inductors. When
exposed to ultra low frequency changing magnetic fields, atomic level
Barkhausen domains in the core, generate pulses that are induced into the copper
winding.
Second, a 1000 uF electrolytic
capacitor is connected in series with the coil. This capacitor functions not
just as a DC blocking element, but also as a detector that generates a small
ultra low frequency voltage, in reaction to the naturally changing ULF field.
This places a continually changing bias on the Barkhausen coil, which has the
effect of making it more sensitive to magnetic activity.
Third, the amplifier itself, like
that described in the Op-Amp Sensor, above, is modulated by the naturally
occuring scalar energy. This serves to further enhance sensitivity, beyond
simple amplifier gain. Lastly, a dual stage integrator circuit, integrates the
Barkhausen pulses into a varying DC voltage. This sensor is enclosed in a
shielded steel case.
The Caduceus Coil Sensor: The
original Caduceus coil detector was invented by our late colleague, Brian
Sallur, of Western Australia Radio Observatory, to detect magnetic energies
from the Sun and Stars, as a tool for astronomy. A Caduceus coil, is a coil wound
back on itself,on a plastic tube form, with 'cross-over' points. This coil has
a self-cancelling inductance. In this application, we are using a shielded
multi-layer Caduceus Coil, to detect mainly changing magnetic field of the
Earth and Sun. The circuit is similar to the Aether-Magnetic Sensor described
above, except for the coil itself, which does not use the Barkhausen effect or
a metal core. Here, the coil's 'cross-over' points themselves, are the sensing
elements.
Types of Activity Detected:
Man Made. Local. Both electric and
magnetic activity.
Solar. Relative to our geographical
positions with respect to the Sun. Mainly magnetic activity.
Stellar. Relative to our
geographical positions with respect to the constellations. Magnetic activity.
Lightning. Global. Lightning strikes
create pulses that travel in the Schumann Corridor.
This is the space between the
conductive Ionosphere and the surface of the Earth, at the speed of light.
Mainly electric but also magnetic activity.
Unknown. Global. Magnetic or
Electric activity that is detected simultaneously, without respect to our
geographical positions.
Below are the most interesting of
the tests we have performed so far and the conclusions we have drawn from them.
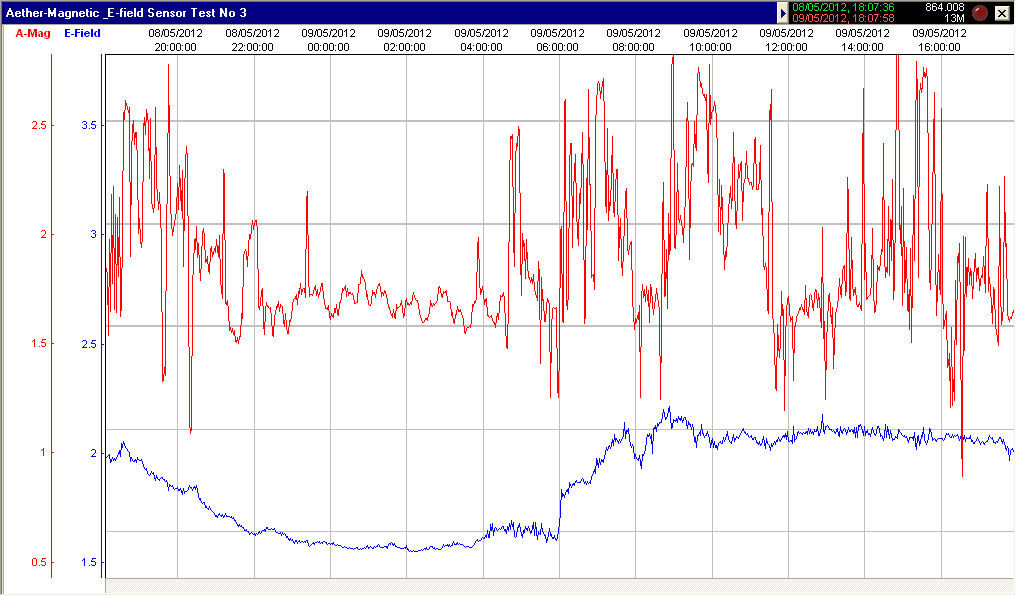
Joint
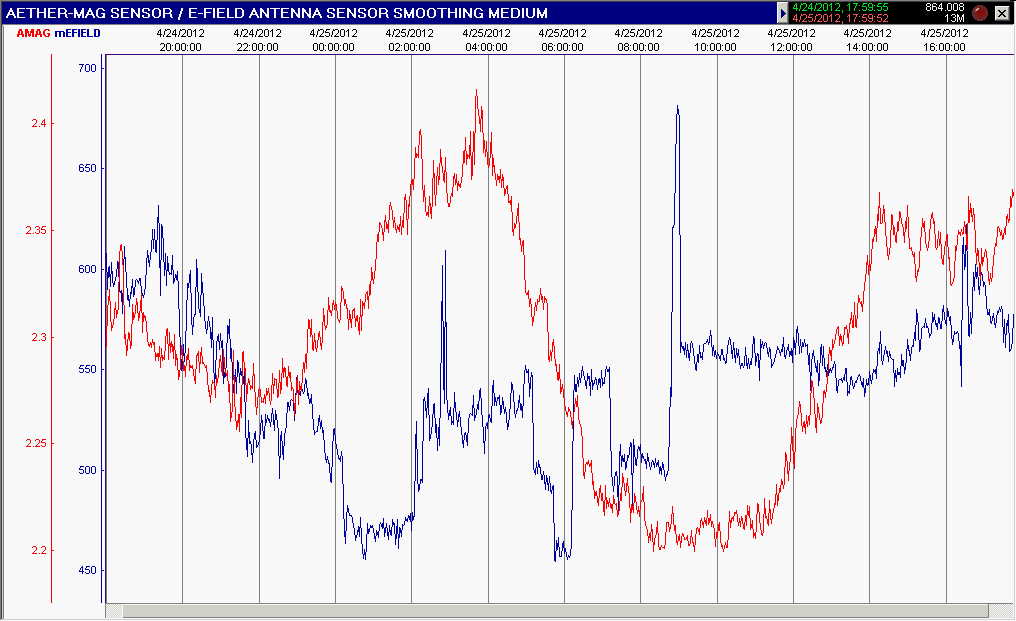
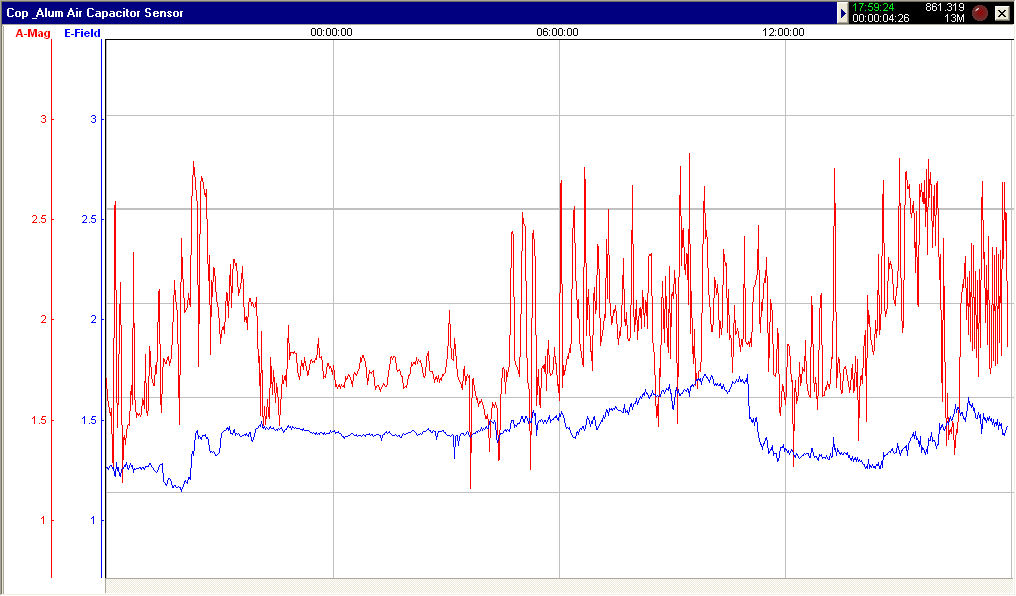
Test 1 2012-04-24
Sensors
Tested – E-Field & Aether-Magnetic
Circuit’s
used – (Both sensors use Long TC circuit with 1000 uF
capacitor on output)
E-Field Circuit \Circuits\efield20212.pdf
Aether-Magnetic Circuit \Circuits\amag20212.pdf
Duration
of Test – 24 hour
Purpose
of Test - To compare data recorded at same UTC times.
Findings
- Aether-Magnetic recordings follow our local positions with respect to the
sun. E-Field seems to follow local electrical activity.
Result
Images
California Test 1\Test 1\T-2012-04-24.jpg
Scotland Test 1\Test 1\P-2012-04-24-25.jpg
Scotland Test 1\Test
1\WINDAQ - Test 2012-04-24.jpg
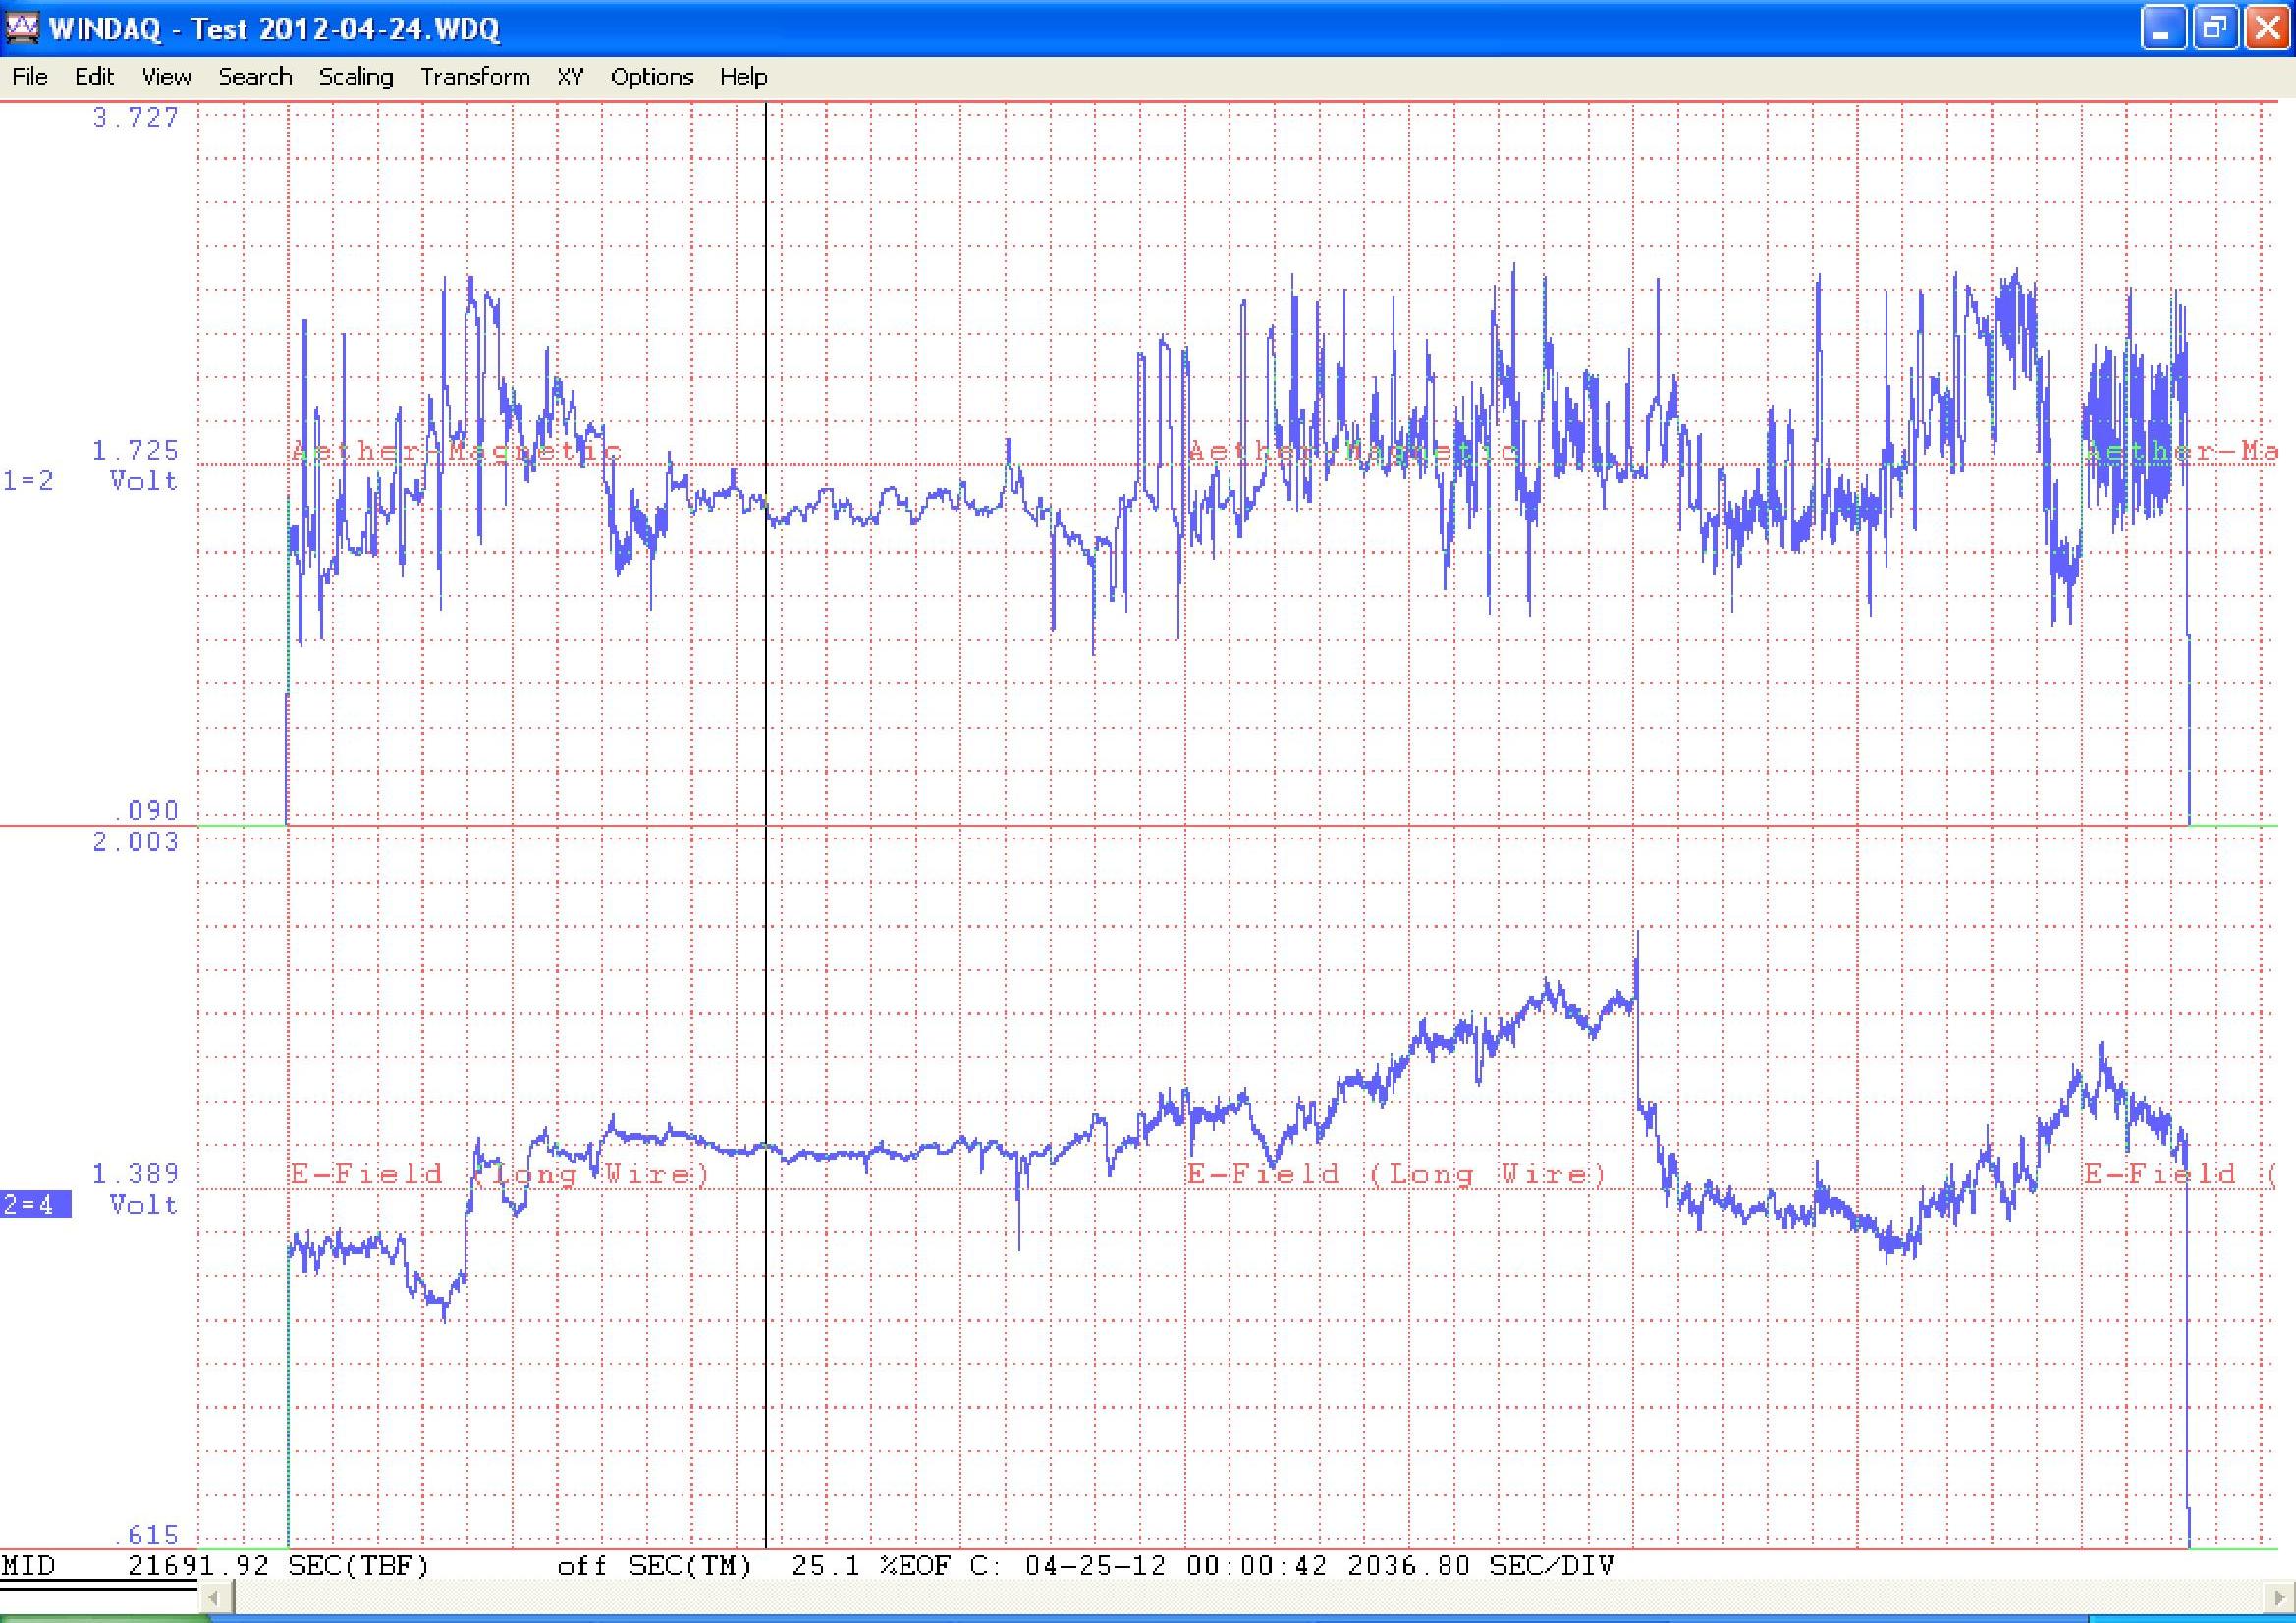
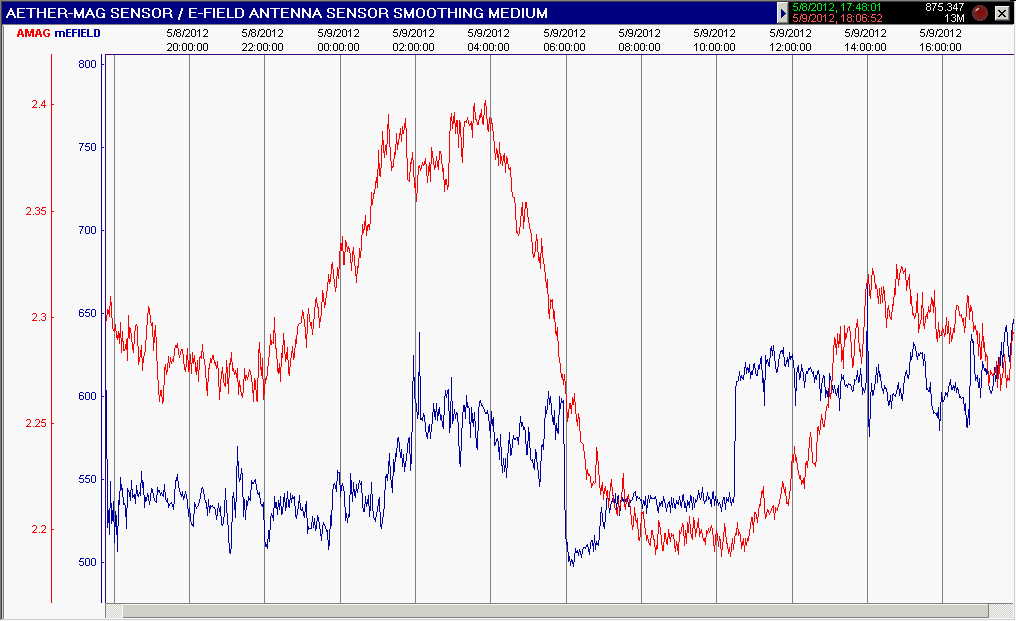
Joint
Test 3 2012-05-08
Sensors
Tested – E-Field & Aether-Magnetic
Circuit’s
used - (Both sensors use Long TC circuit with 1000 uF
capacitor on output)
E-Field
Circuit \Circuits\efield20212.pdf
Aether-Magnetic
Circuit \Circuits\amag20212.pdf
Duration
of Test – 24 hour
Purpose
of Test - To compare data recorded at same UTC times.
Findings
-Similar to test 1, but with a few events in common to both our locations.
Result
Images
California Test 3\Test 3\T-2012-05-08.jpg
Scotland Test 3\Test 3\P-2012-05-09.jpg
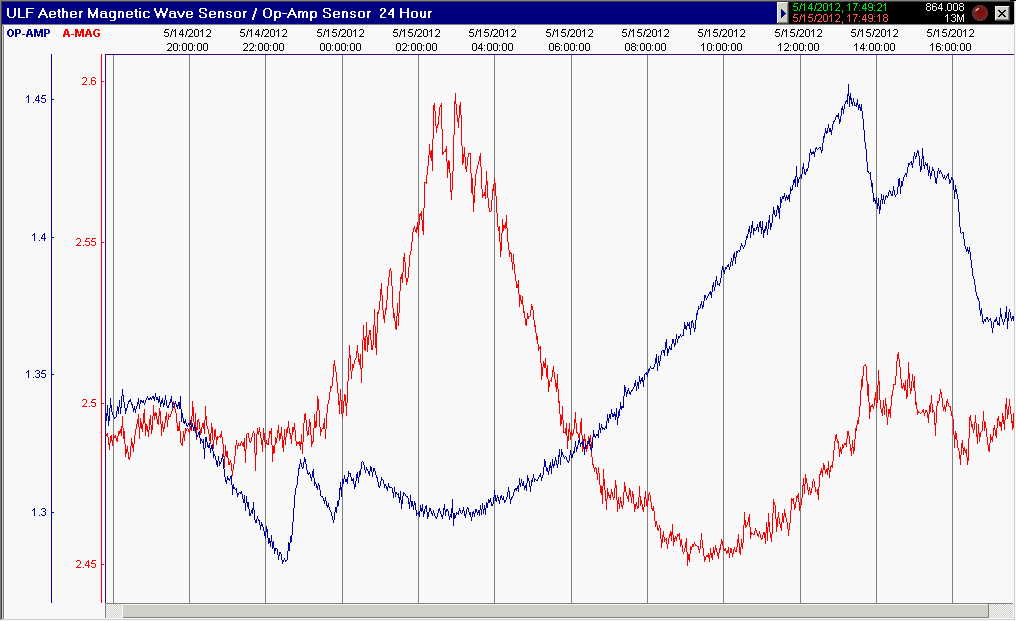
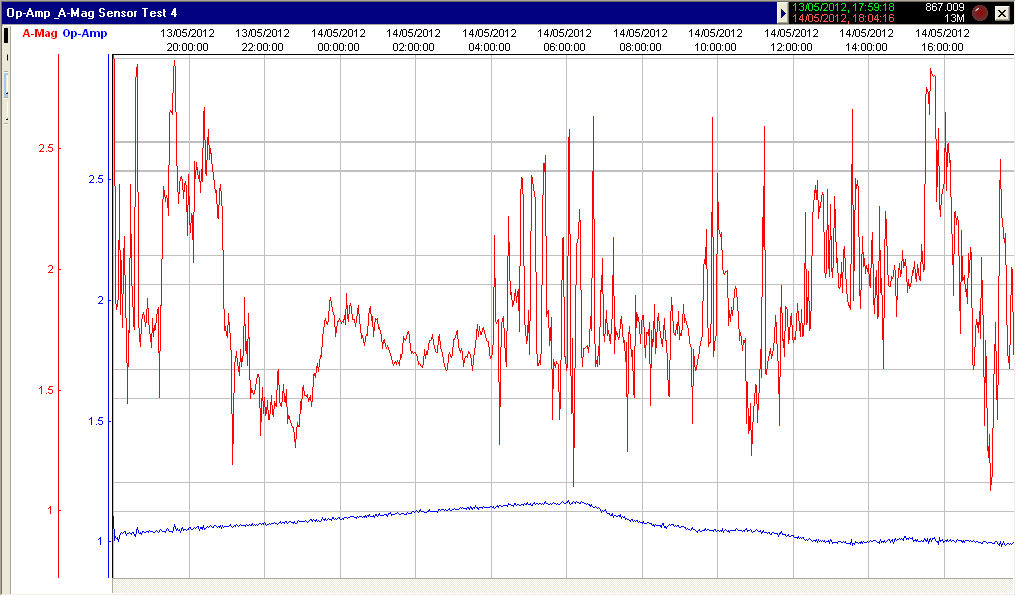
Joint
Test 4 2012-05-14
Sensors
Tested – Aether-Magnetic & Op-Amp
Circuit’s
used – (Aether-Magnetic uses Long TC with 1000 uf and
Op-Amp Sensor uses Short TC circuit with 10 uF on output)
Aether-Magnetic
Circuit \Circuits\amag20212.pdf
Op-Amp Circuit \Circuits\opamp20212.pdf
Duration
of Test – 24 hour
Purpose
of Test – To see how our Op-Amp sensors and Aether-Magnetic
sensors compare to each other and between our two recordings.
Findings
– Op-Amp sensor has a daily cycle of its own and does not track Aether-Mag
daily cycle.
Result
Images
California Test 4\Test 4\T-2012-05-14.jpg
Scotland Test 4\Test 4\P-T-2012-05-14
Test 4.jpg
Scotland Test 4\Test 4\WINDAQ -
P-2012-05-14.jpg
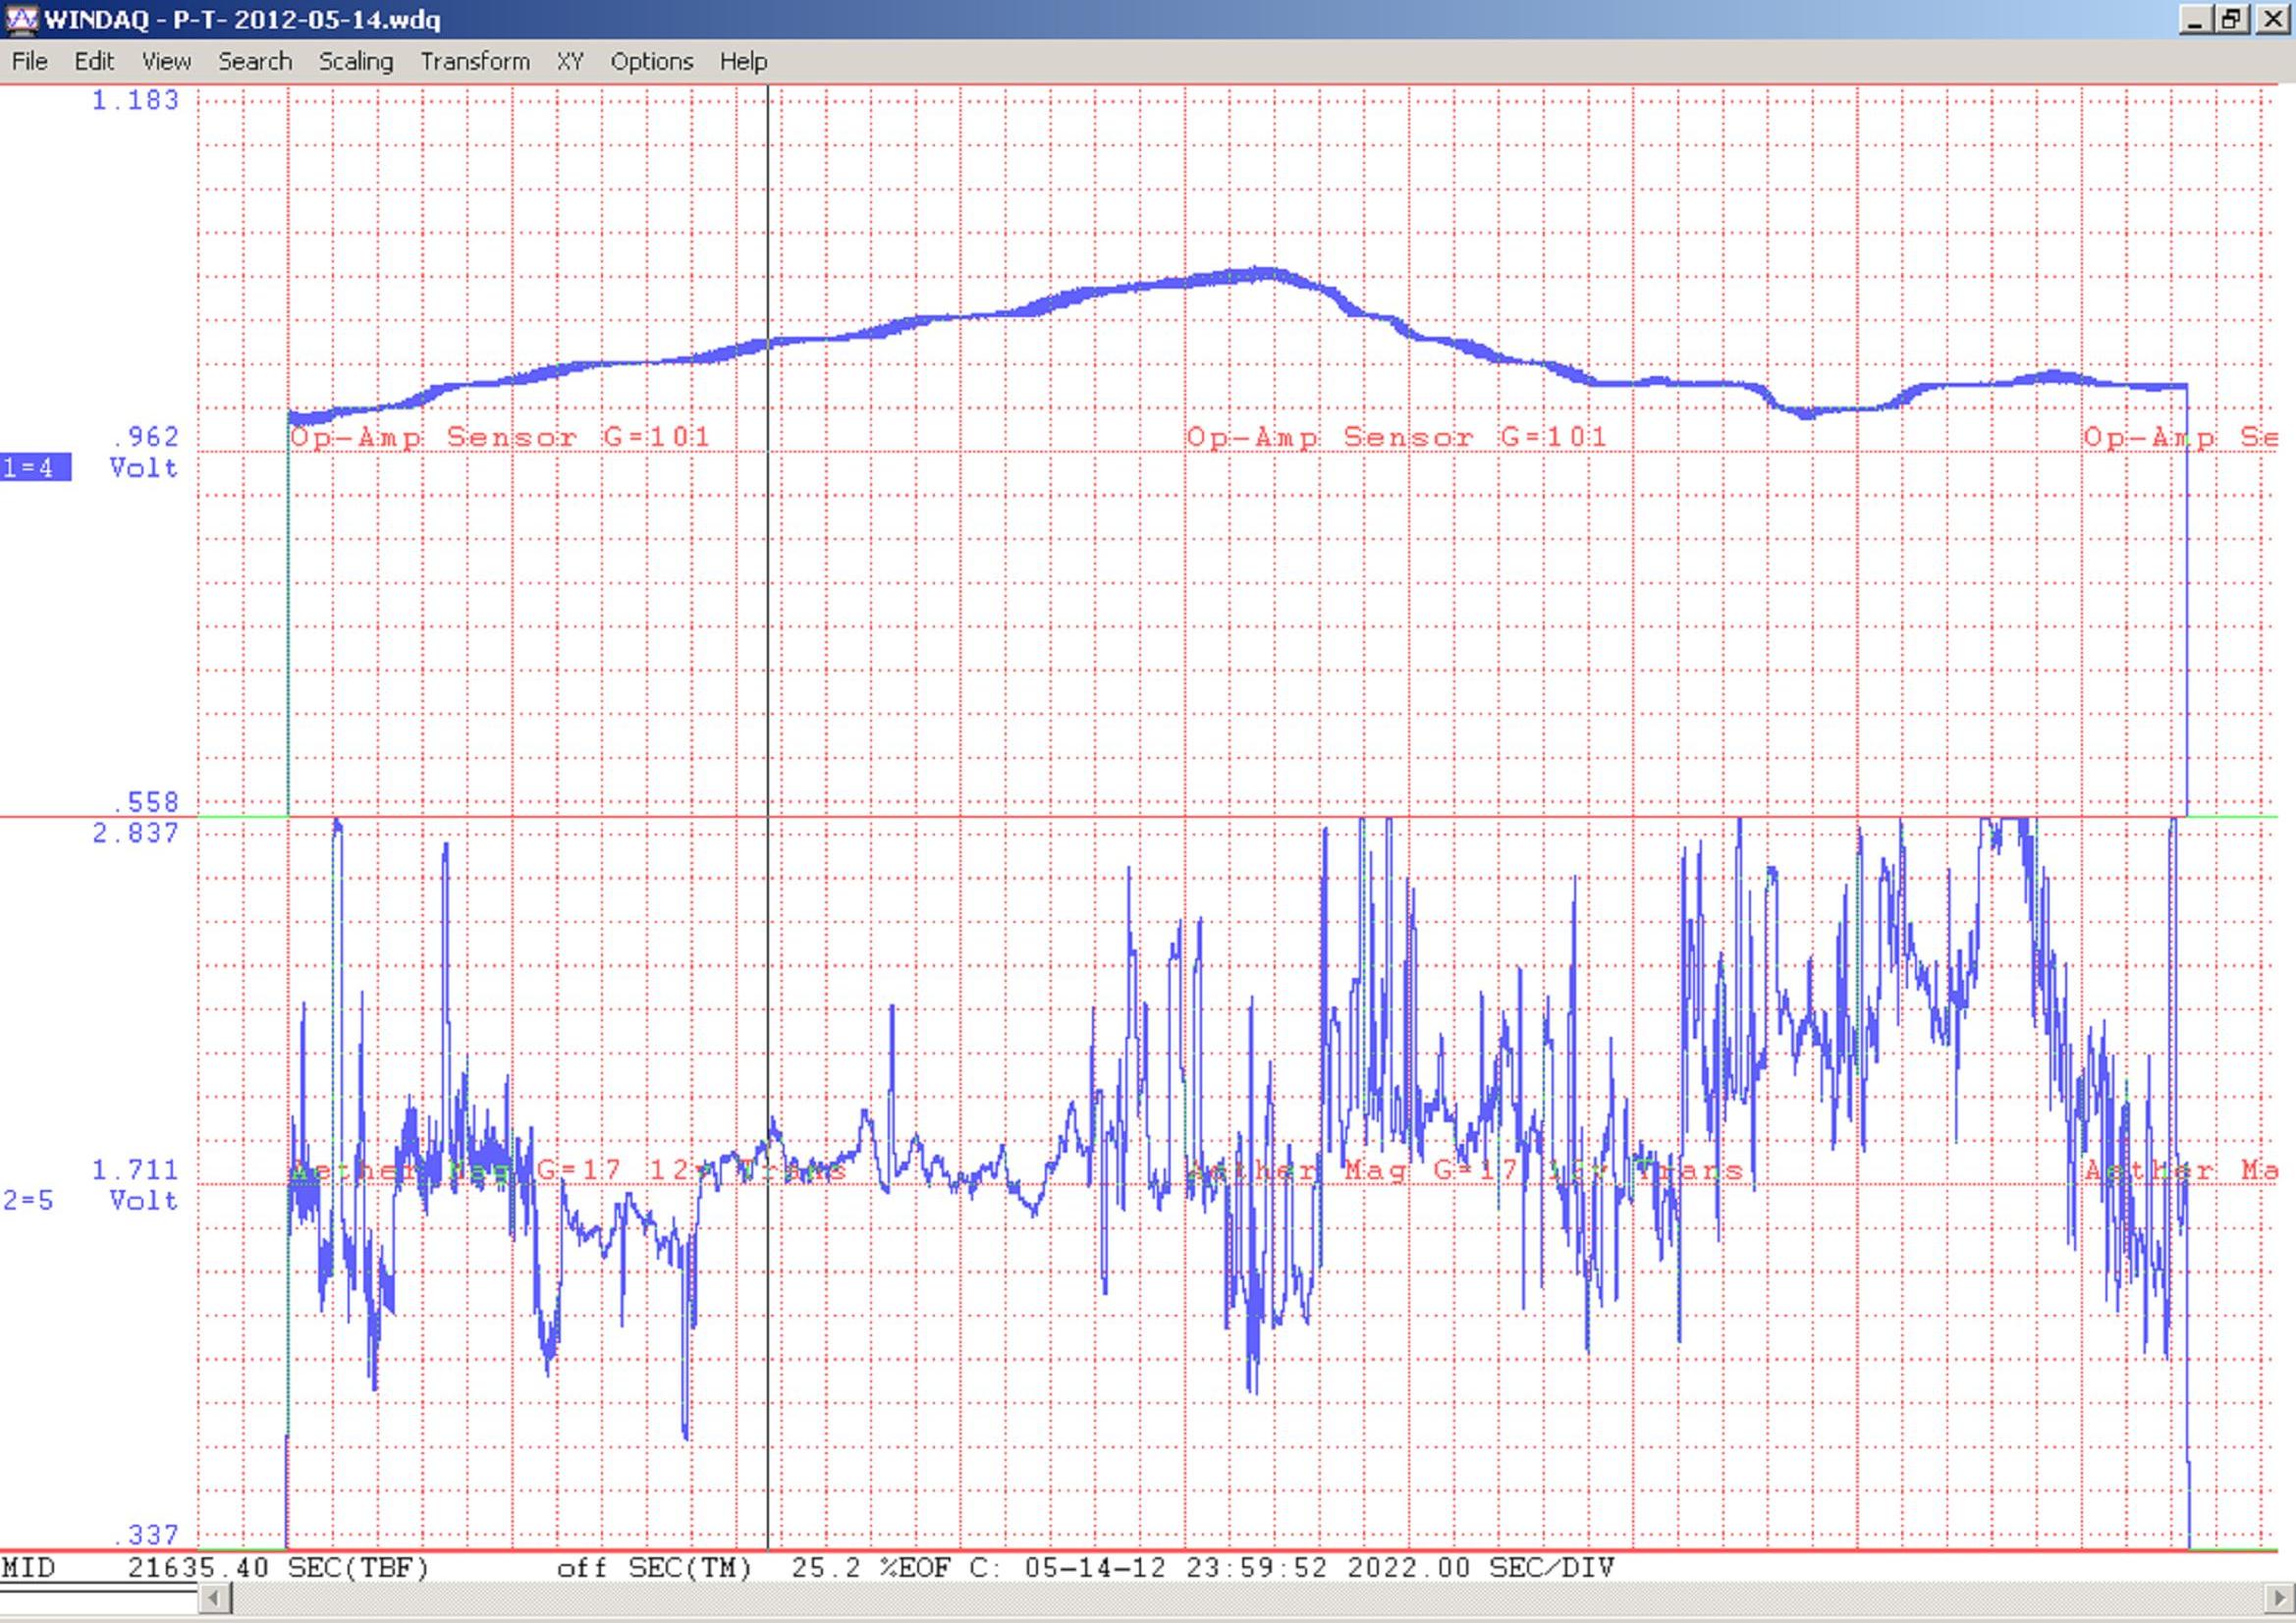
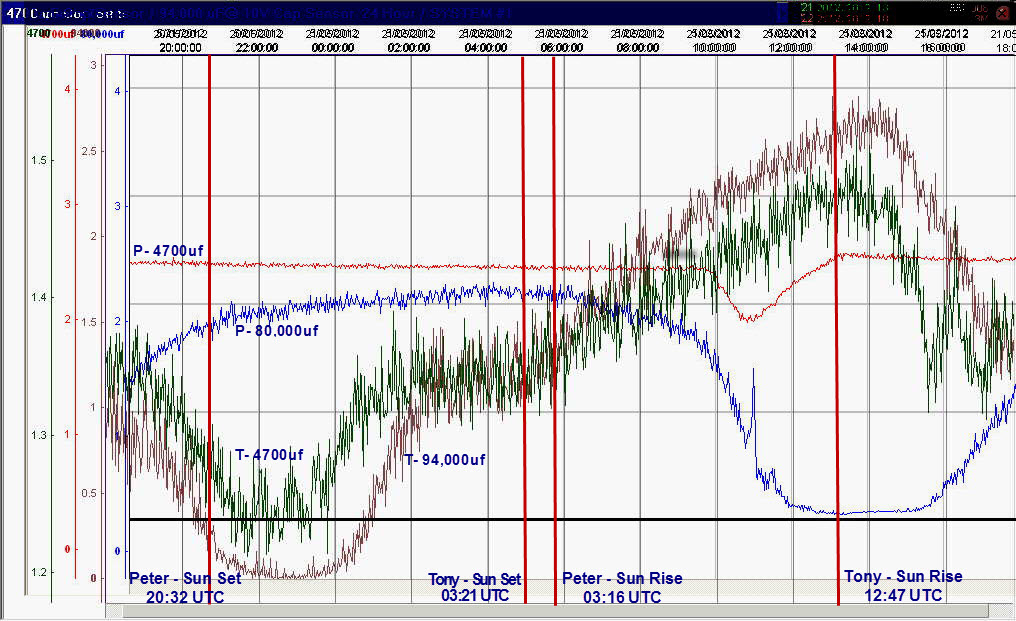
Joint
Test 5 2012-05-22
Sensors
Tested – 4700uf capacitor & P=80,000uf / T=94,000uf
capacitor
Circuit’s
used – Capacitor Sensor
Capacitor Sensor \Circuits\cap20212.pdf
Duration
of Test – 24 hour
Purpose
of Test – To compare capacitors of different values as
sensors.
Findings
-Peter's 4700 uF had low output Peter's 80,000 uF, had major fluxuation over 24
hours as did Tony's 4700 uF and 94,000 uF.
Result
Images
Scotland and
California\Test 5\Merge P&T-2012-05-21 Test 5c.jpg
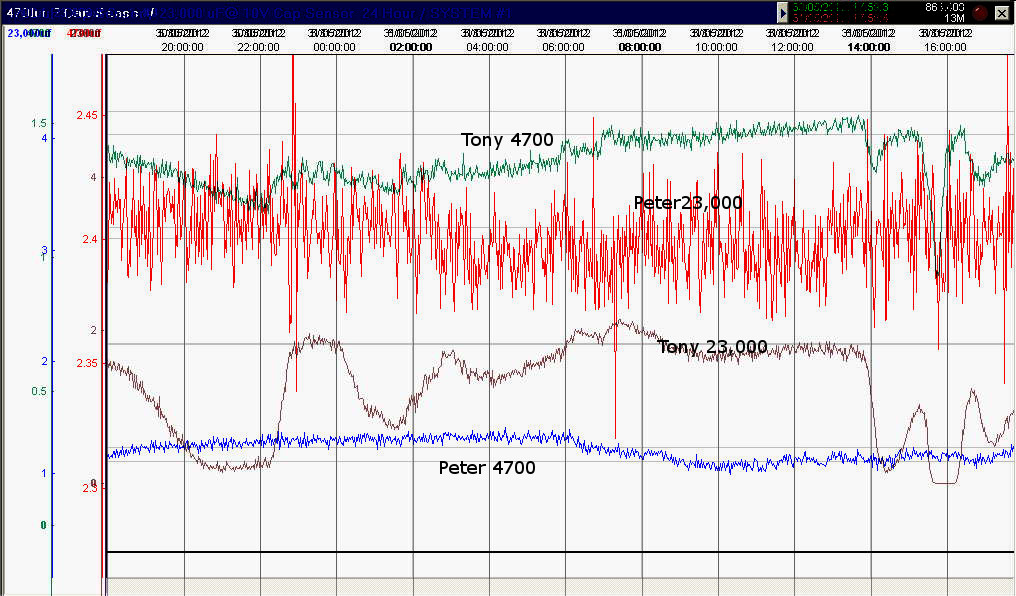
Joint
Test 6 2012-05-31
Sensors
Tested – P = 4700uf, 23,000uf, 80,000uf & 185,000uf
capacitor
- T= 4700uf, 23,000uf, 94,000uf, &
230,000uf capacitor
Duration
of Test – 24 hour
Circuit’s
used - Capacitor Sensor
Capacitor
Sensor \Circuits\cap20212.pdf
Purpose
of Test - To compare capacitors of different values as
sensors.
Findings
– All capacitors displayed different waves over 24 hours.
Result
Images
Scotland and California
Image 1\Test 6\P-2012-05-31 new merge 060412.jpg
Scotland and
California Image 2\Test 6\P-2012-05-31 new merge 060412-B.jpg
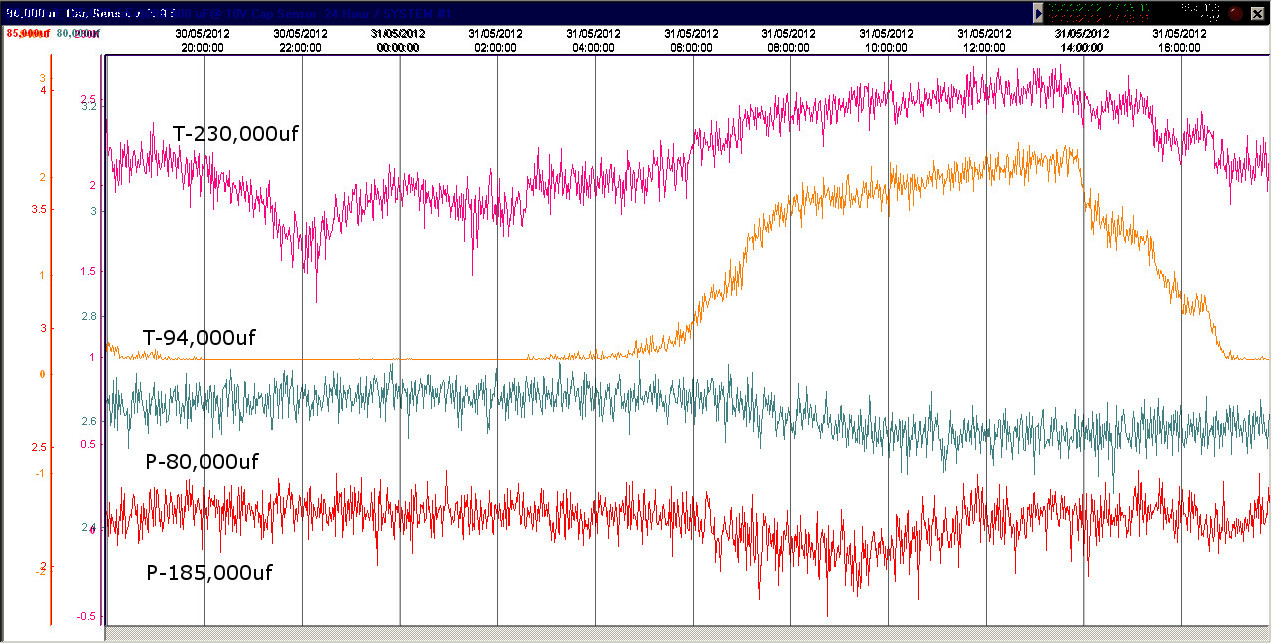
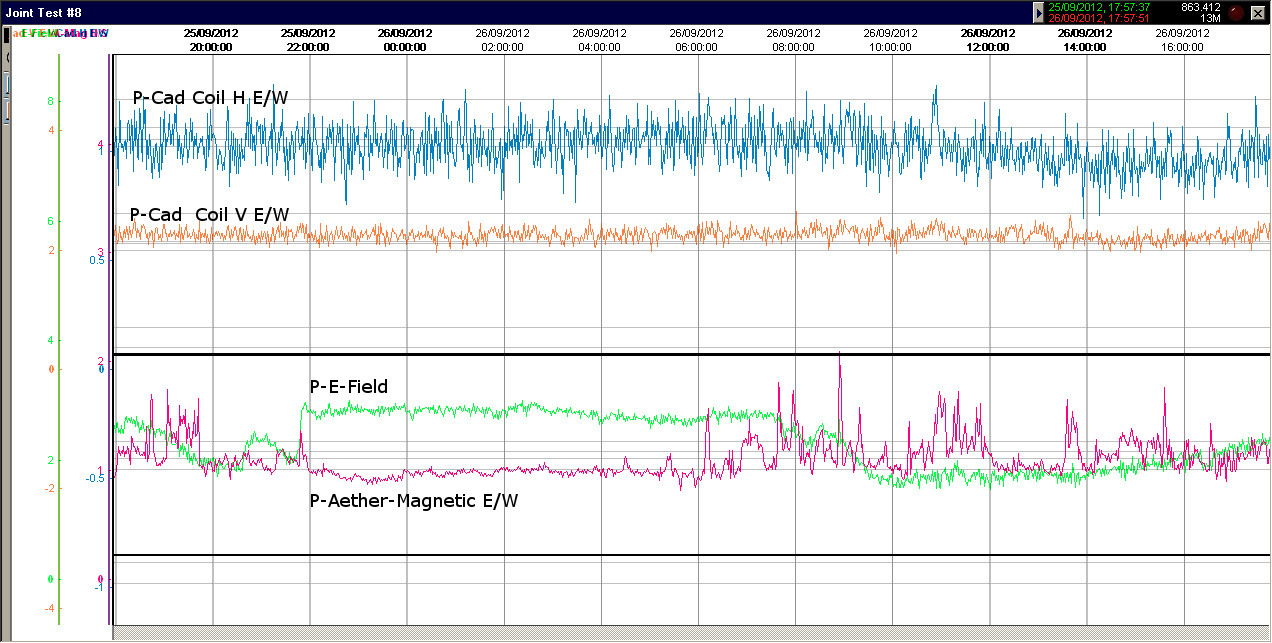
Joint
Test 8 2012-09-24
Sensors
Tested –
Day
1 = E-Field, Aether-Magnetic – N/S, Cad Coil-vertical N/S, Cad Coil –
horizontal N/S
Day
2 = E-Field, Aether-Magnetic - E/W, Cad Coil-vertical E/W, Cad Coil –
horizontal E/W
Circuit’s
used - (Both sensors use Long TC circuit with 1000 uF
capacitor on output)
E-Field
Circuit \Circuits\efield20212.pdf
Aether-Magnetic
Circuit \Circuits\amag20212.pdf
Caduceus Coil Circuit \Circuits\cad092412.pdf
Picture of Caduceus Coil Wound On Cardboard
Tube \Circuits\cadcoilwinding.JPG
Note: Both Caduceus Coils were
installed in grounded (earthed) metal enclosures.
Duration
of Test – 2 x 24 hour (2 Days)
Purpose
of Test – To compare Aether-Magnetic, E-Field and Caduceus
sensors output, at both locations over 48 hours.
Findings
-With Caduceus and Aether-Magnetic sensors changed in position from North-South
to East-West for the second day of recording
Result
Images
California Day 1\Test 8\T-2012-09-24C.jpg
California Day 2\Test 8\T-2012-09-25C.jpg
Scotland Day 1\Test 8\P-2012-09-24
both.jpg
Scotland Day 2\Test 8\P-2012-09-25
both.jpg
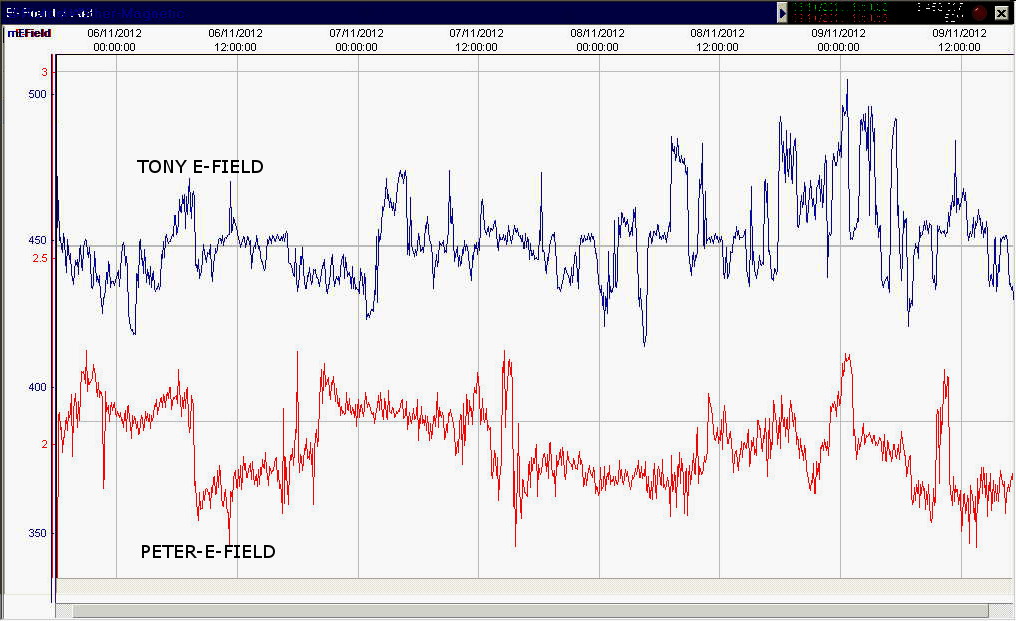
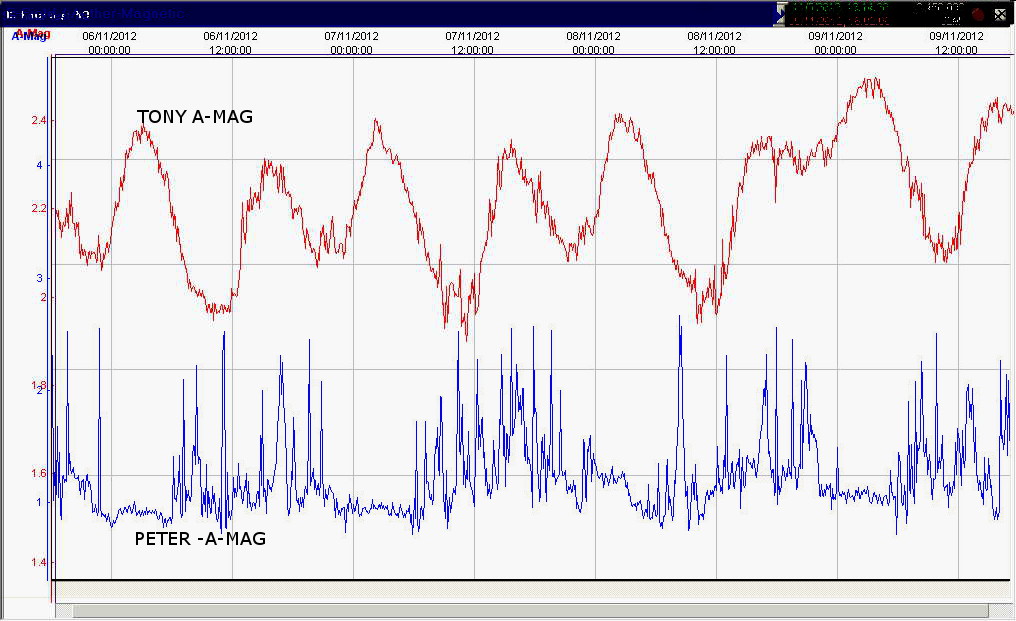
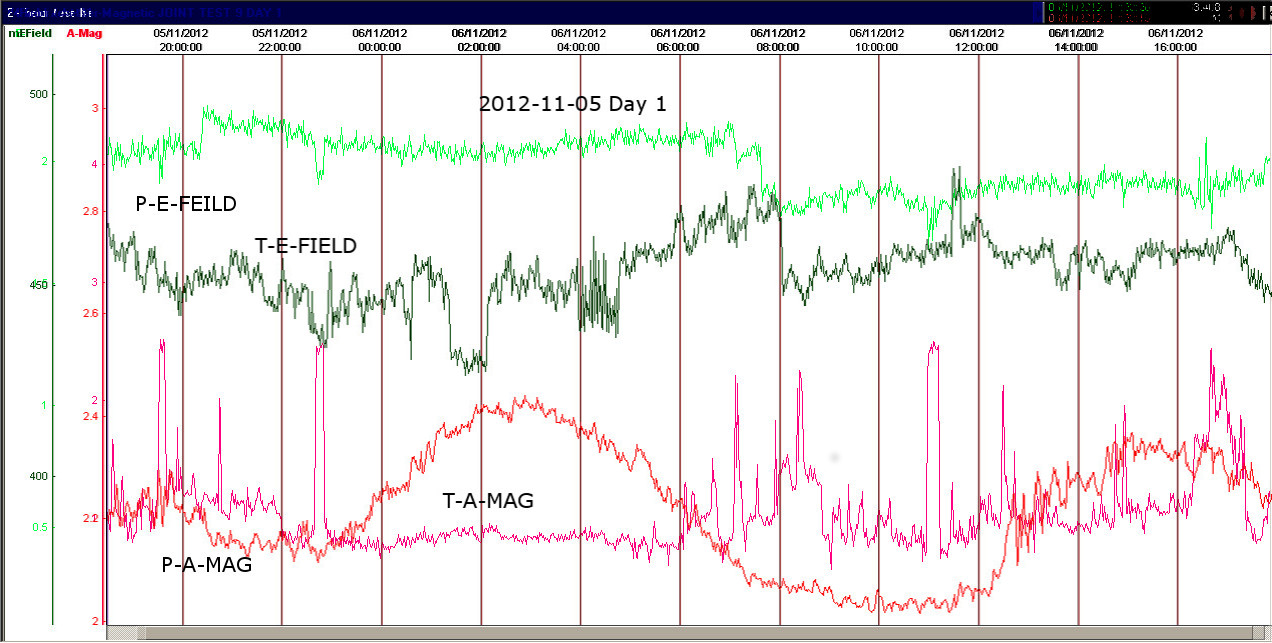
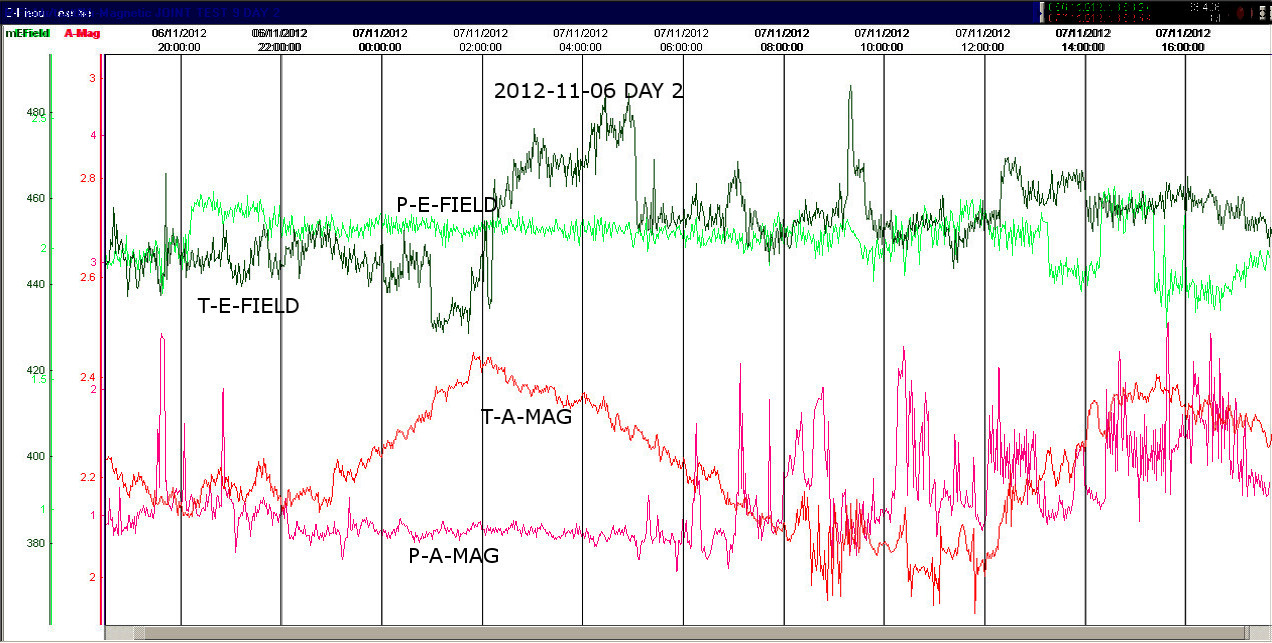
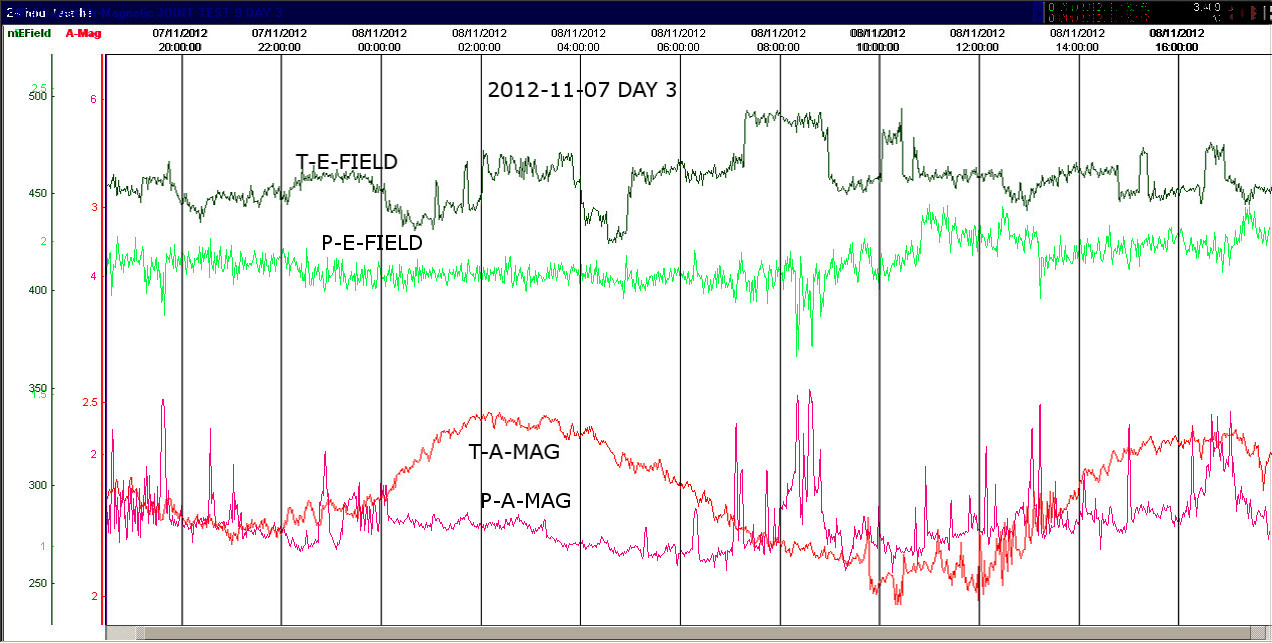
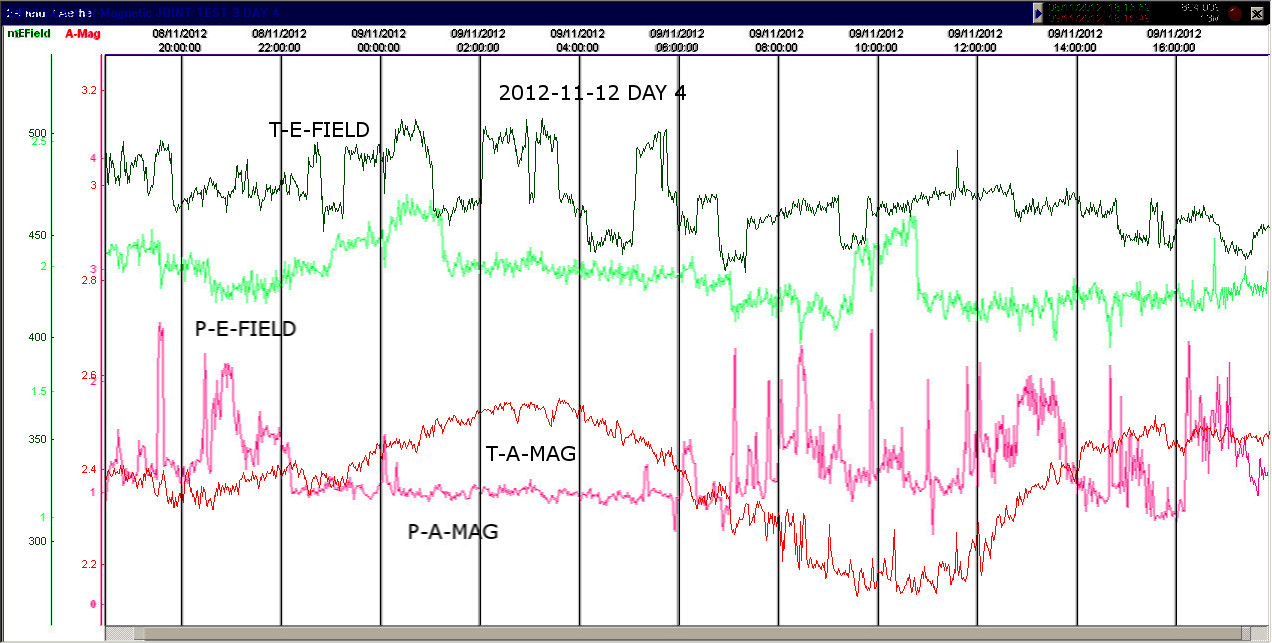
Joint
Test 9 2012-11-06 to 09
Sensors
Tested – E-Field & Aether-Magnetic
Circuit’s
used -(Both sensors use Long TC circuit with 1000 uF
capacitor on output)
E-Field
Circuit \Circuits\efield20212.pdf
Aether-Magnetic
Circuit \Circuits\amag20212.pdf
Duration
of Test – 4 day continuous recording & 4 x 24 hour
recordings
Purpose
of Test – To compare Aether-Magnetic and E-Field data over
four days.
Findings
- Aether-Magnetic waves record daily cycles relative to our geographical
positions, with respect to the sun. E-Field activity is from local electrical
phenomena and also some common activity from both locations believed to be
lightning.
Result
Images
California 4 Day Merge 1\Test
9\T-efield-1-merge.jpg
California 4 Day Merge 2\Test
9\T-amag-2-merge.jpg
Scotland Day 1 Merge\Test
9\P-2012-11-05-MERGE.jpg
Scotland Day 2 Merge\Test
9\P-2012-11-06-MERGE.jpg
Scotland Day 3 Merge\Test
9\P-2012-11-07-MERGE.jpg
Scotland Day 4 Merge\Test
9\P-2012-11-08-MERGE.jpg
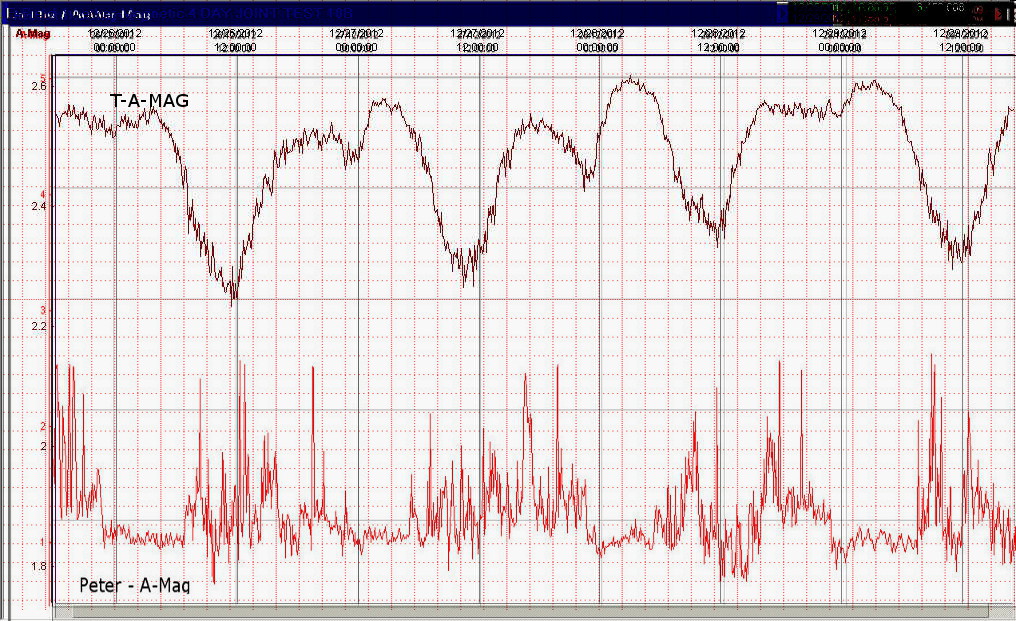
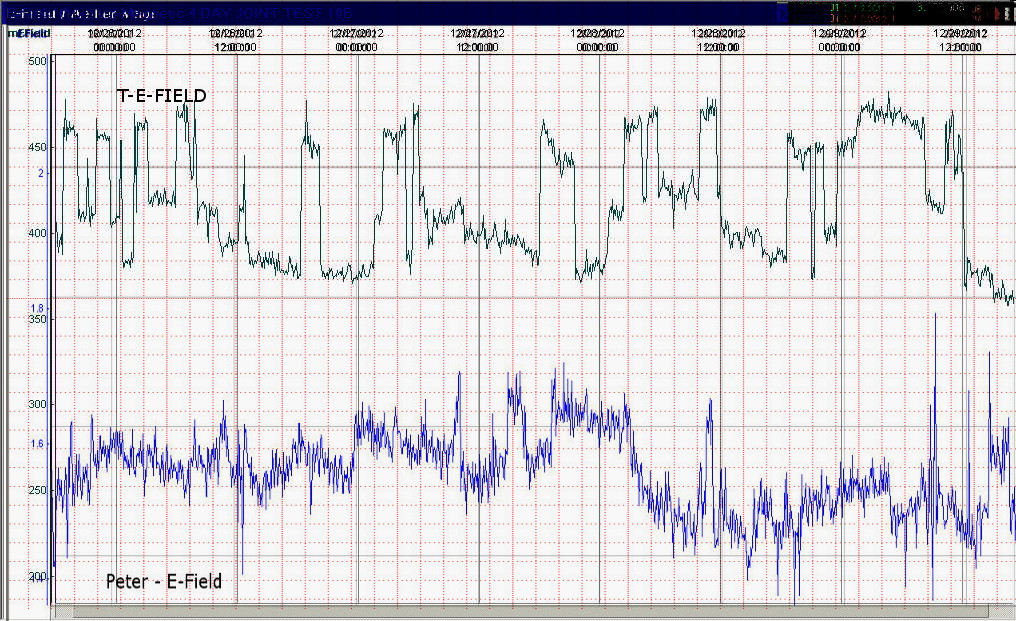
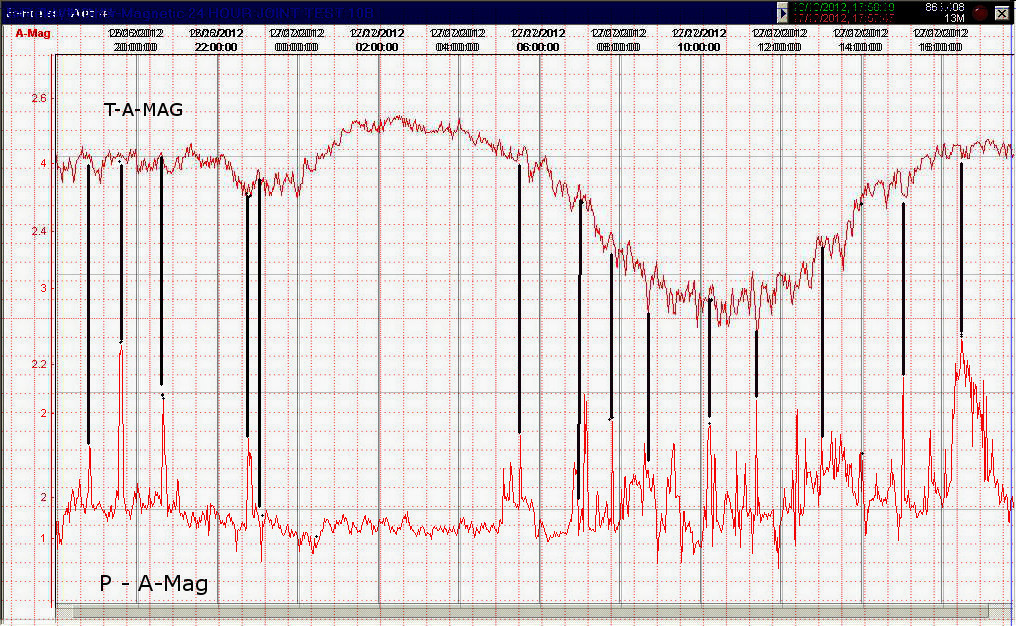
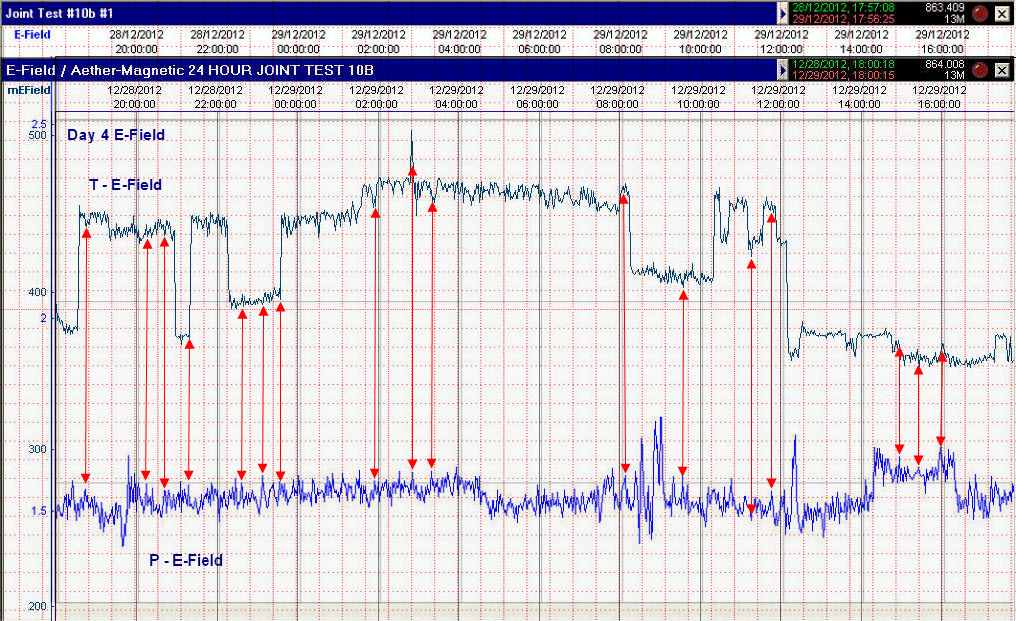
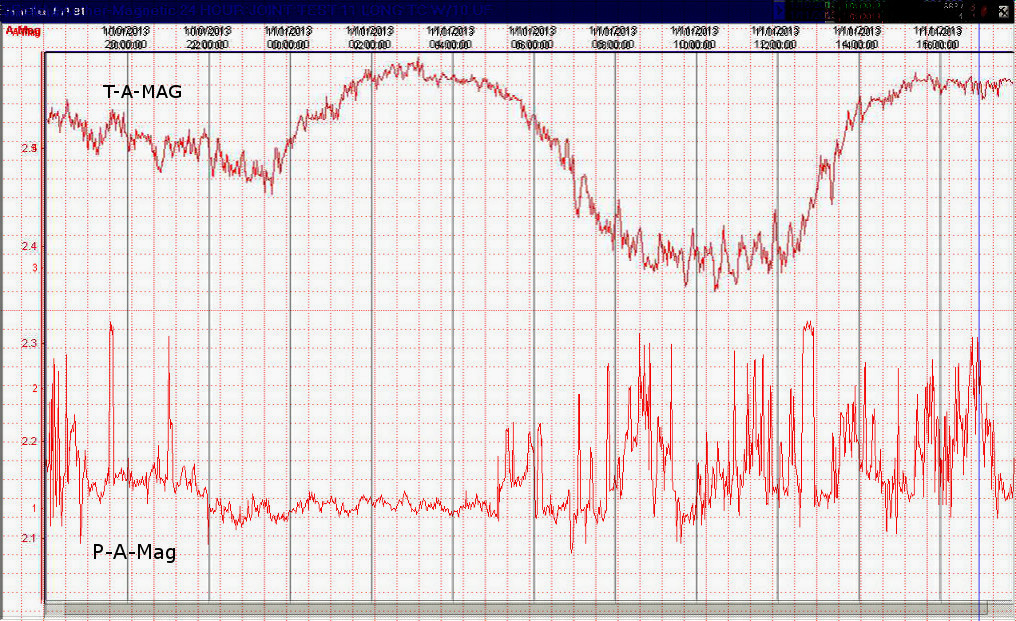
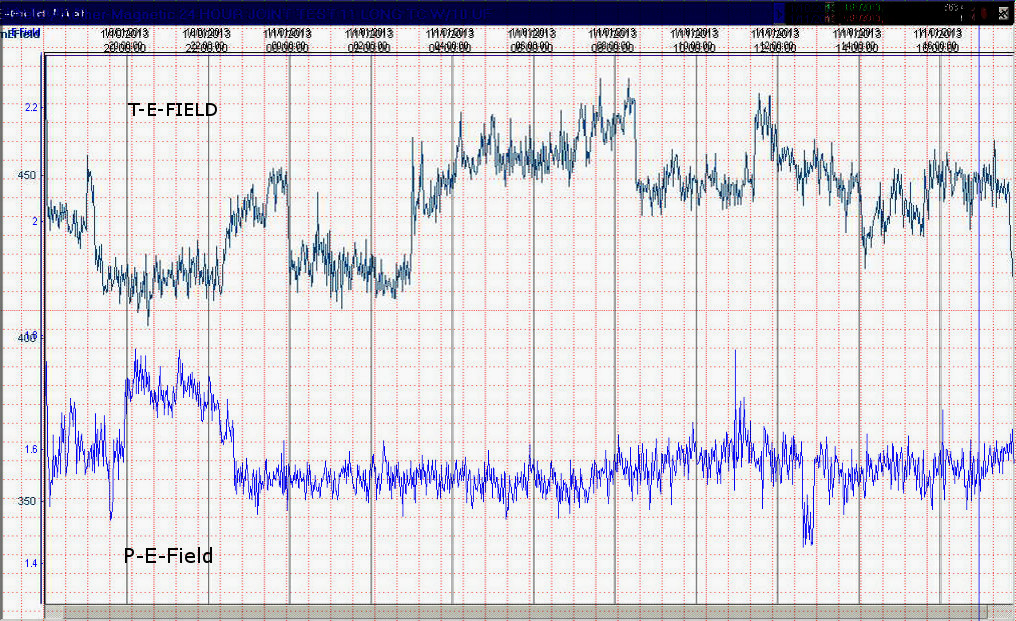
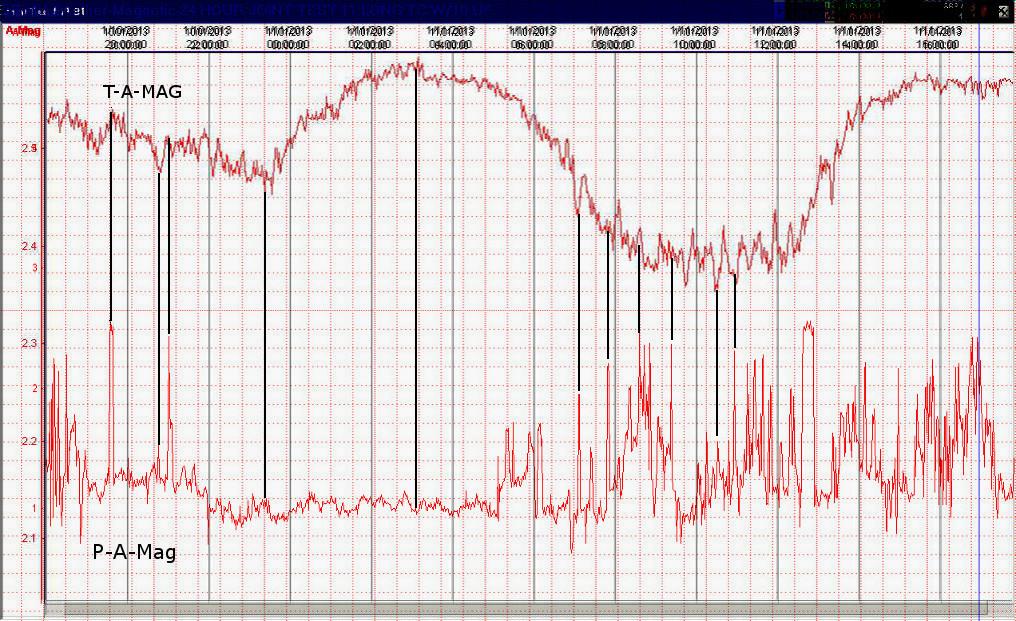
Joint
Test 10b 2012-12-25 to 29
Sensors
Tested – E-Field & Aether-Magnetic
Circuit’s
used – (Both sensors use Long TC circuit with 1000 uF
capacitor on output)
E-Field
Circuit \Circuits\efield20212.pdf
Aether-Magnetic
Circuit \Circuits\amag20212.pdf
Duration
of Test – 4 day continues record with 4 x 24 hour record
Purpose
of Test – Looking at trends in the recording.
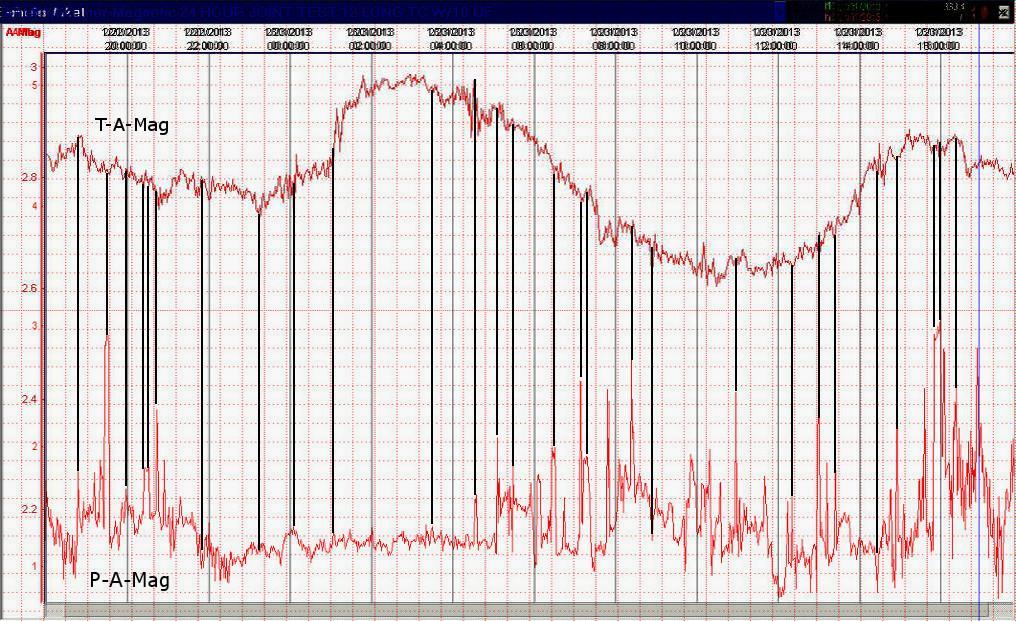
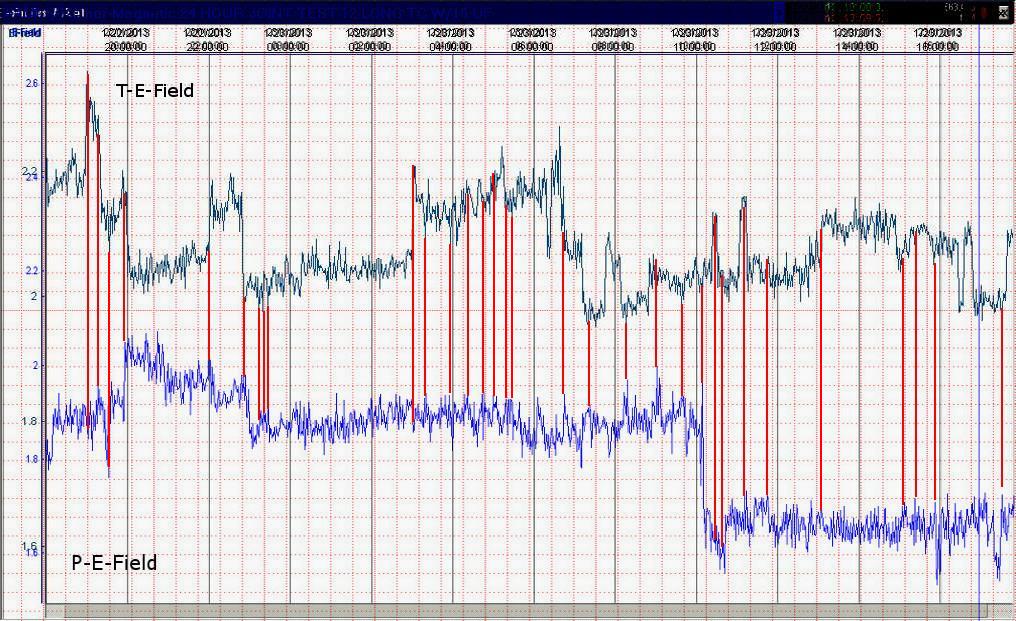
Findings
–
1.
Match ups were found in all the
sensors tested between both of our locations
2.
Below are our recordings for the
four day period plus the matches that were found on one of the days, chosen at
random (Day number 2)
Result
Images
SC
and CA 4 Days A-Mag\Test 10\P & T-2012-12-25 TO 29 A-MAG 4 DAYS Merged b.jpg
SC
and CA 4 Day E-Field\Test 10\P & T-2012-12-25 TO 29 E-FIELD 4 DAYS Merged
b.jpg
Scotland
and California Day 2 A-Mag Matches\Test 10\T-P 2012-12-26 TO 27 A-MAG DAY 2
L.jpg
California Day 2
E-Field Matches\Test 10\P-T-Day 2 E-FIELD TONY MARKED.jpg
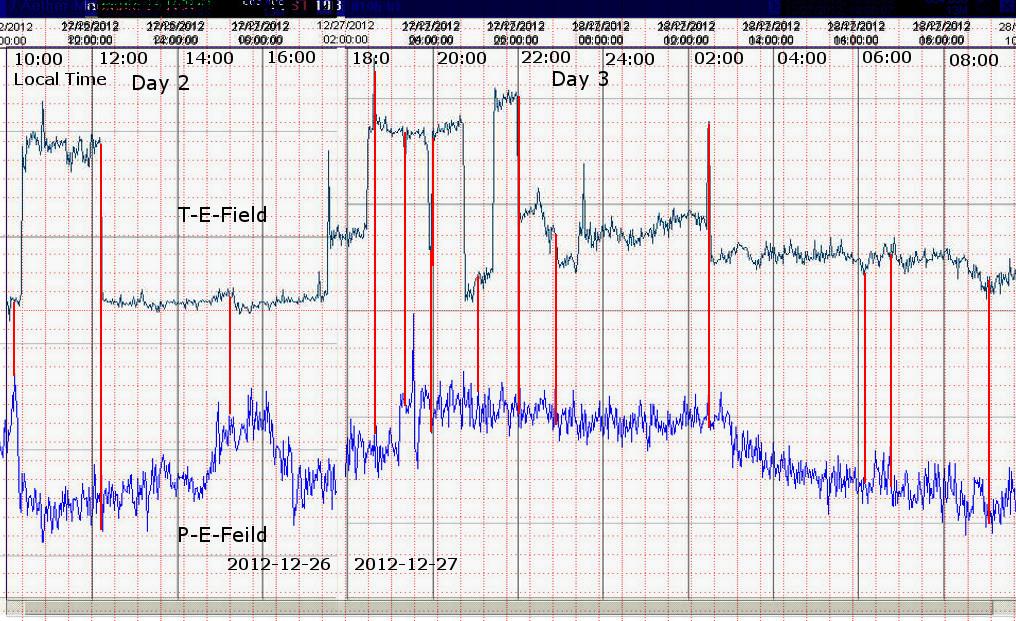
Scotland
Day 2 E-Field Matches\Test 10\P&T-Day 2 W-Field merged e marked.jpg
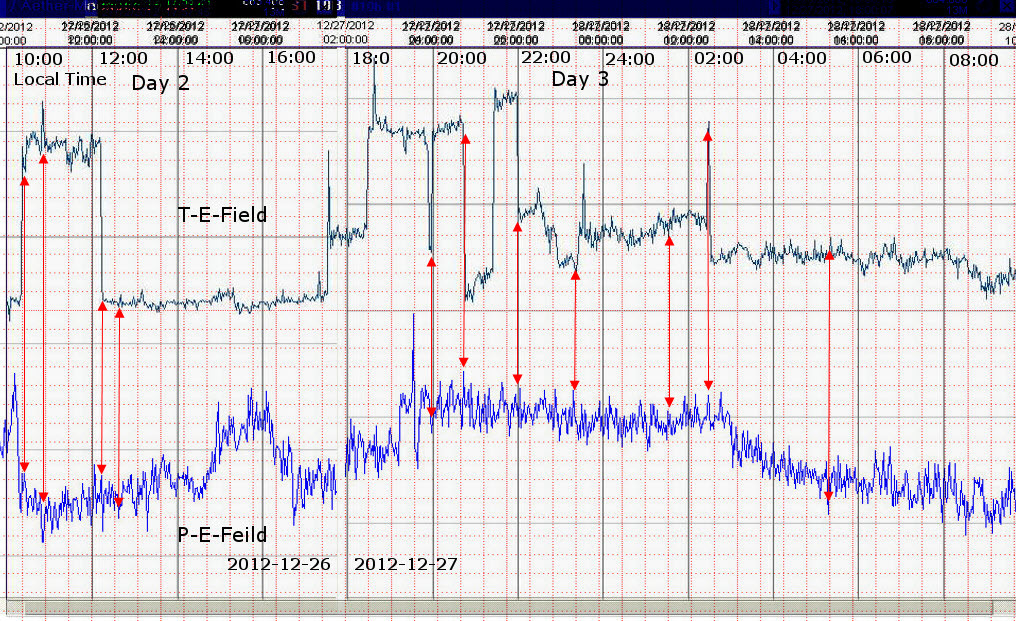
Scotland Day 4
E-Field Matches\Test 10\P&T-Day 4 E-Field Merged Marked.jpg
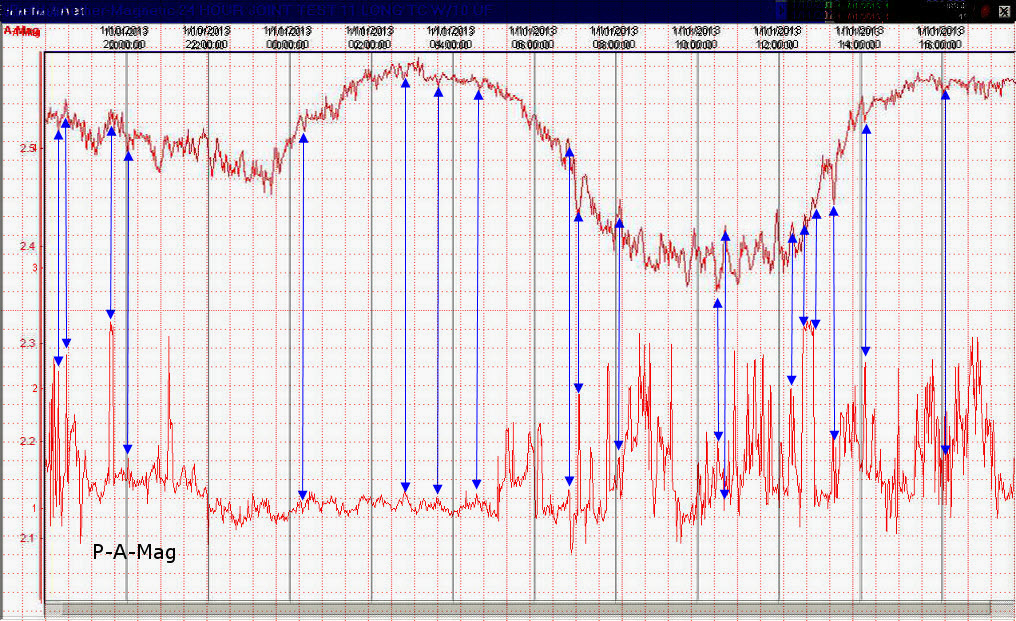
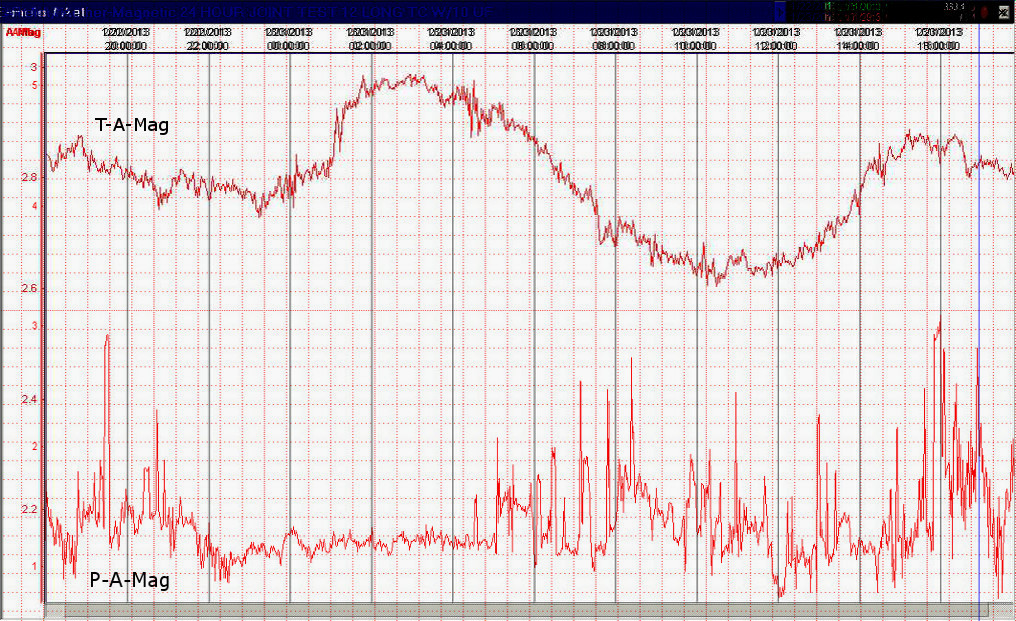
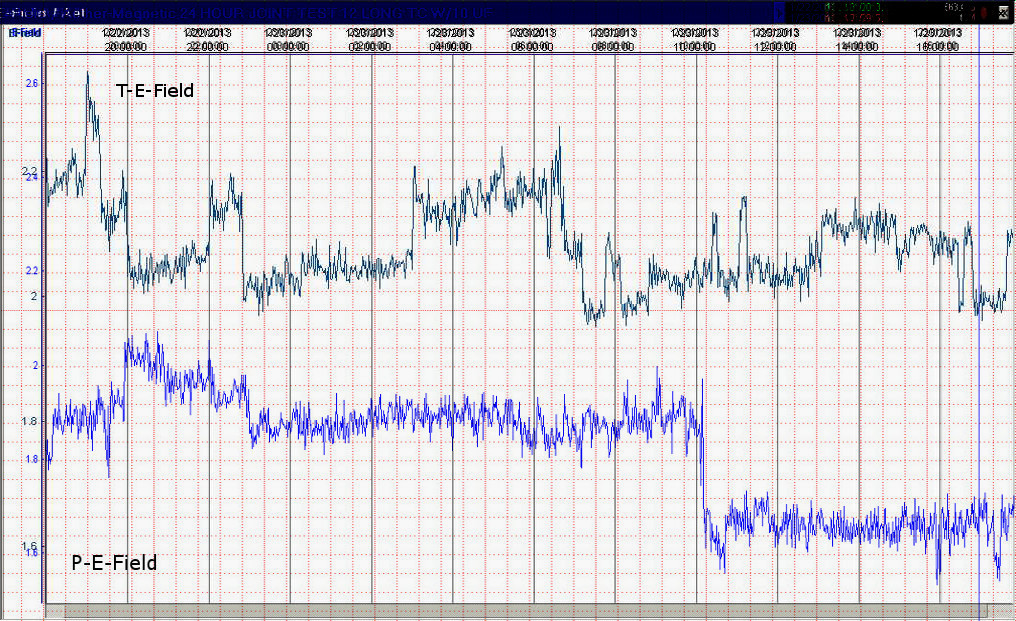
Joint
Test 11 2013-01-10 to 11
Sensors
Tested – E-Field & Aether-Magnetic
Circuit’s
used -(Both sensors NOW use Long TC circuit with 10 uF
capacitor on output)
E-Field Circuit \Circuits\efield021513.pdf
Aether-Magnetic Circuit \Circuits\amag021513.pdf
Duration
of Test – 24 hour test
Purpose
of Test - Checking for lightning strikes between both of our
locations
Findings
–
1.
Match ups were found in all the
sensors tested between both of our locations
2.
We checked the full 24 hours for
lightning strikes
3.
Output filter capacitors changed
from 1000 uF to 10 uF. (Both Sensors)
Note
– lightning data only available for
Result
Images
A-Mag Merged\Test
11\T-P-2013-01-10 A-MAG MERGED W GRID.jpg
E-Field
Merged\Test 11\T-P-2013-01-10 E-FIELD MERGED W GRID.jpg
California A-Mag
Matches\Test 11\T-P-2013-01-10 A-MAG MERGED MARKED.jpg
California
E-Field Matches\Test 11\T-P-2013-01-10 E-FIELD MERGED MARKED.jpg
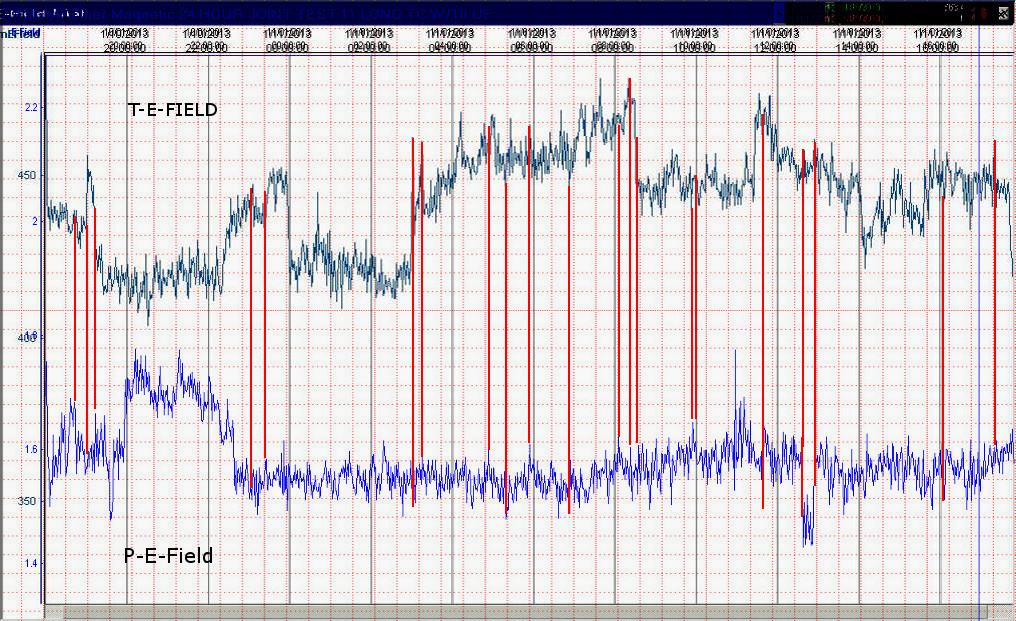
Scotland
A-Mag Matches\Test 11\P-T-2013-01-10 to 11 J-T 11 A-Mag merged marked b.jpg
Scotland
E-Field Matches\Test 11\P-T-2013-01-10 to 11 J-T 11 E-Field merged marked b.jpg
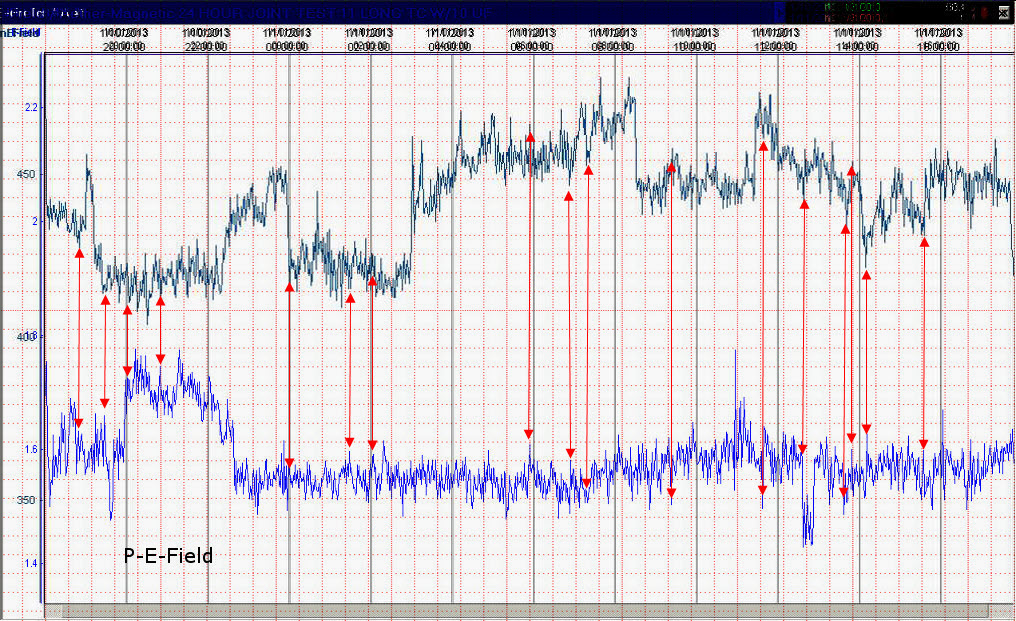
E-Field
Matching 12 Hour Trend\Test 11\P-T- joint test 11 12 hour merge-b.jpg
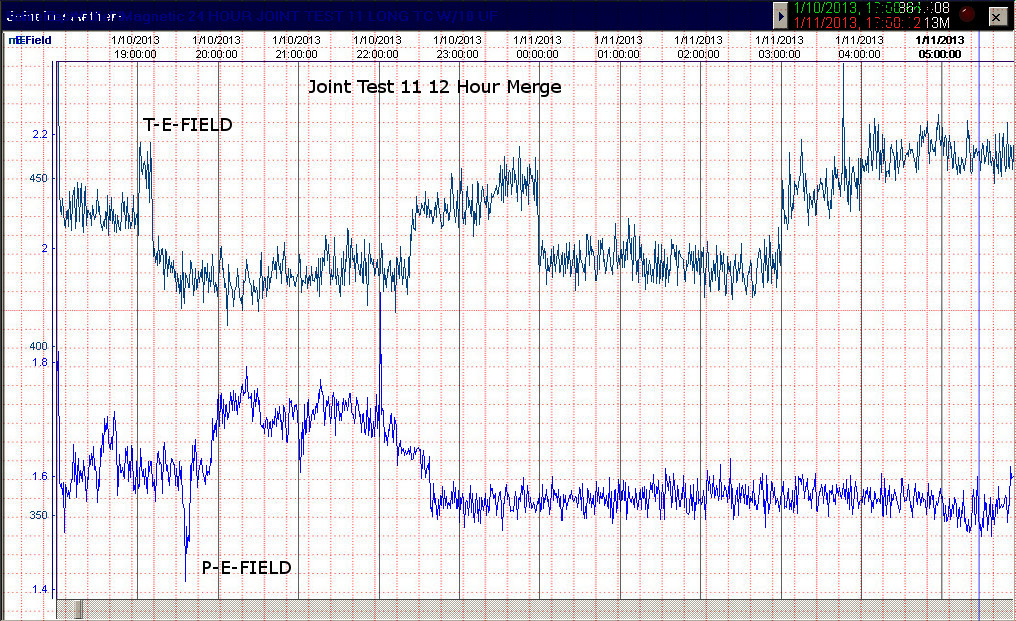
Note:
The above matches, are events that show up on large time spans. Lightning
matches are usually only seen on charts with a time span of a few minutes.
Lightning
Match Examples:
Scotland Example 1\Test
11\P-Lightning Match 01-47-02.jpg
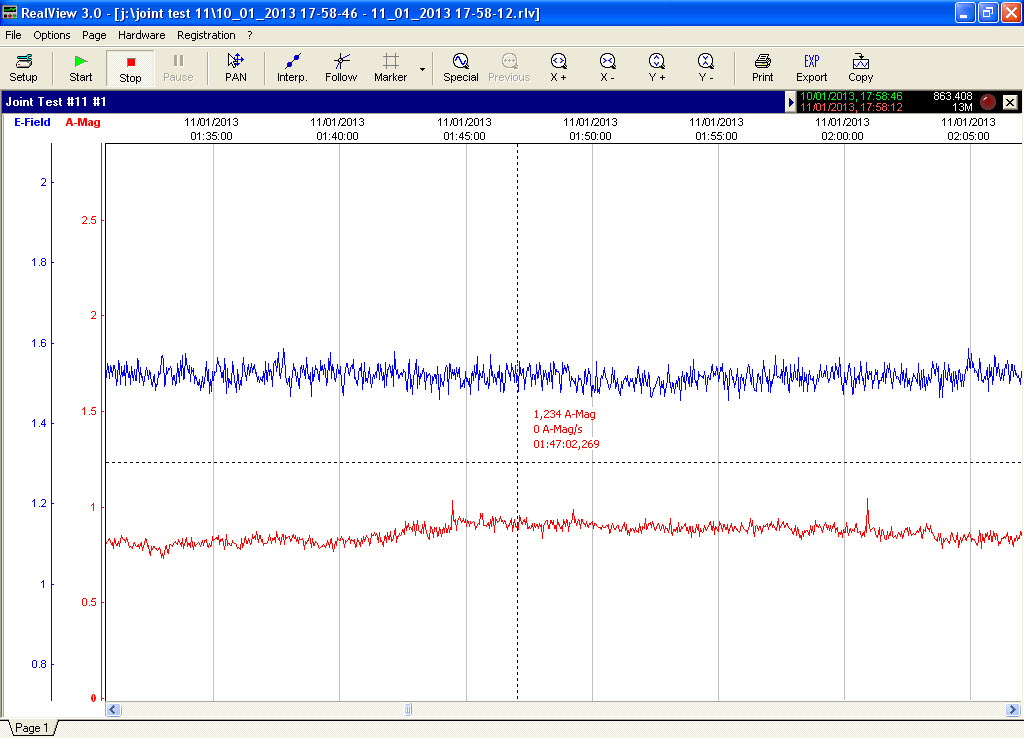
California Example
1\Test 11\T-Lightning Match 01 47 02.jpg
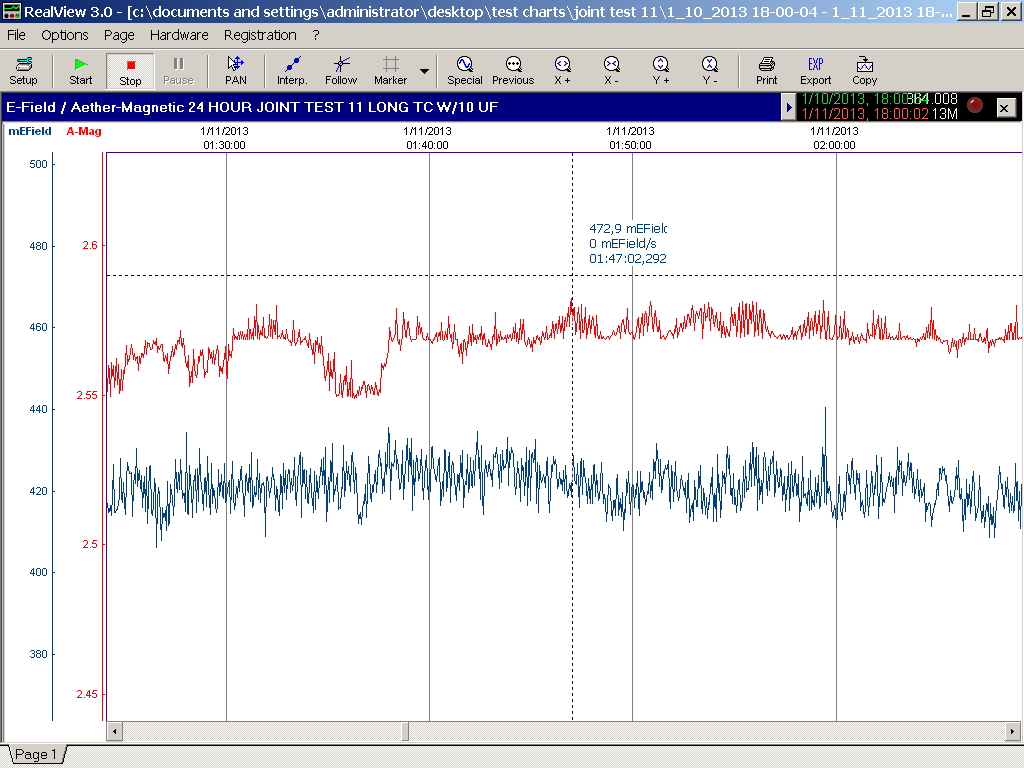
Scotland Example 2\Test
11\P-Lightning Match 08-32-59.jpg
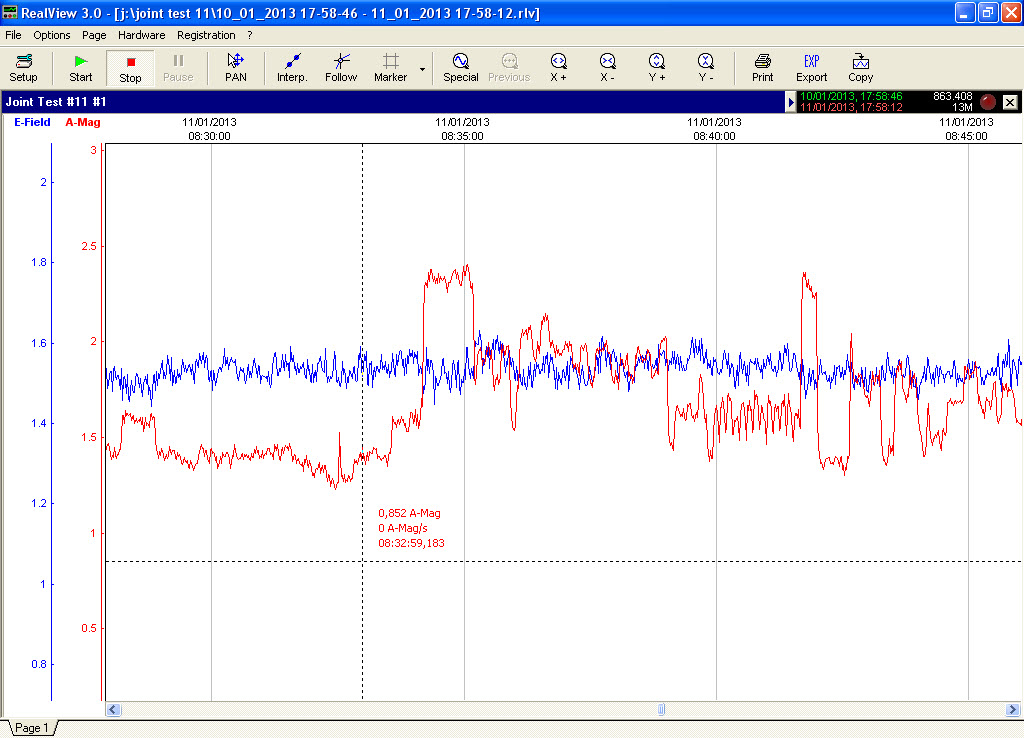
California Example
2\Test 11\T-Lightning Match 08 32 59.jpg
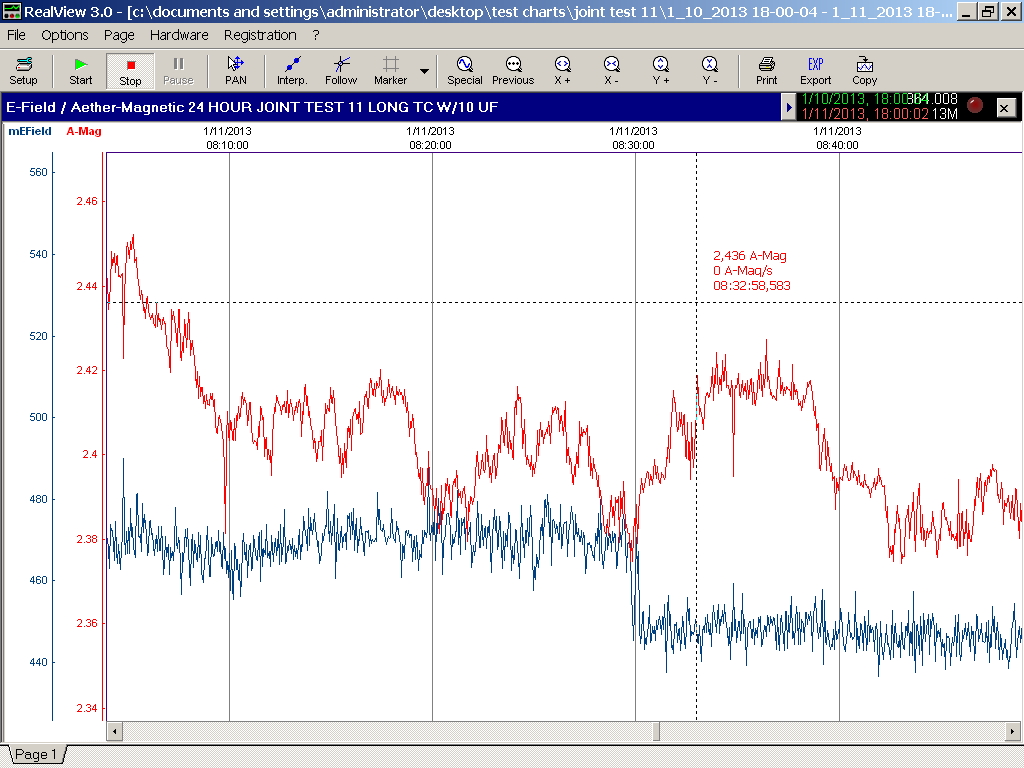
Scotland Example 3\Test
11\P-Lightning Match 17-51-54.jpg
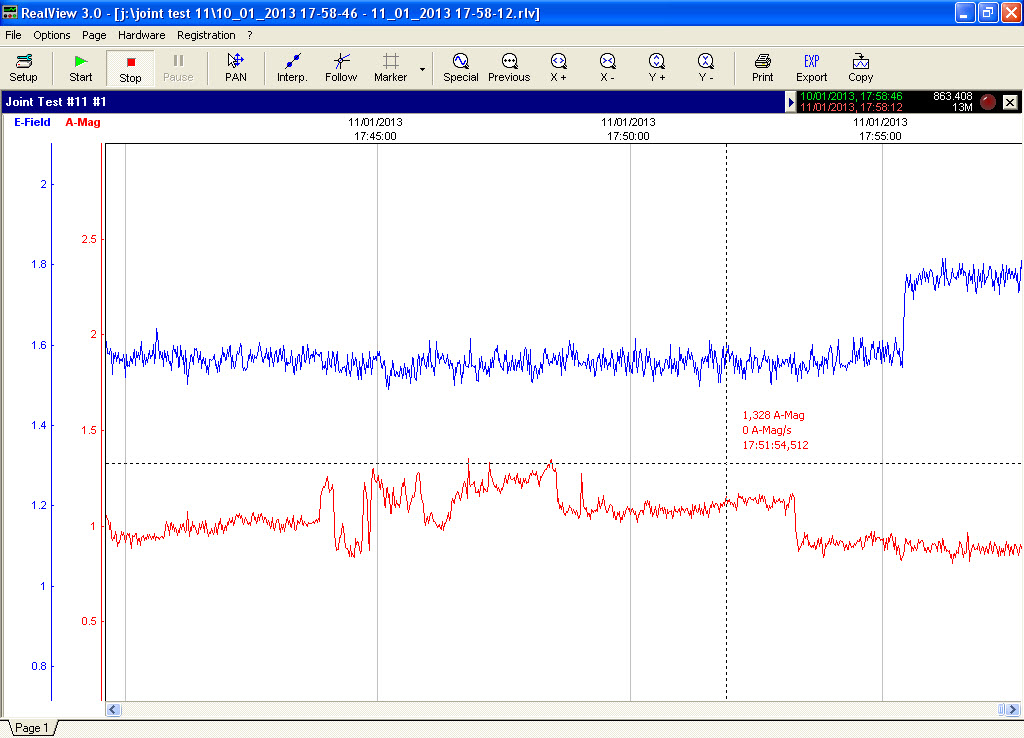
California Example
3\Test 11\T-Lightning Match 17 51 54.jpg
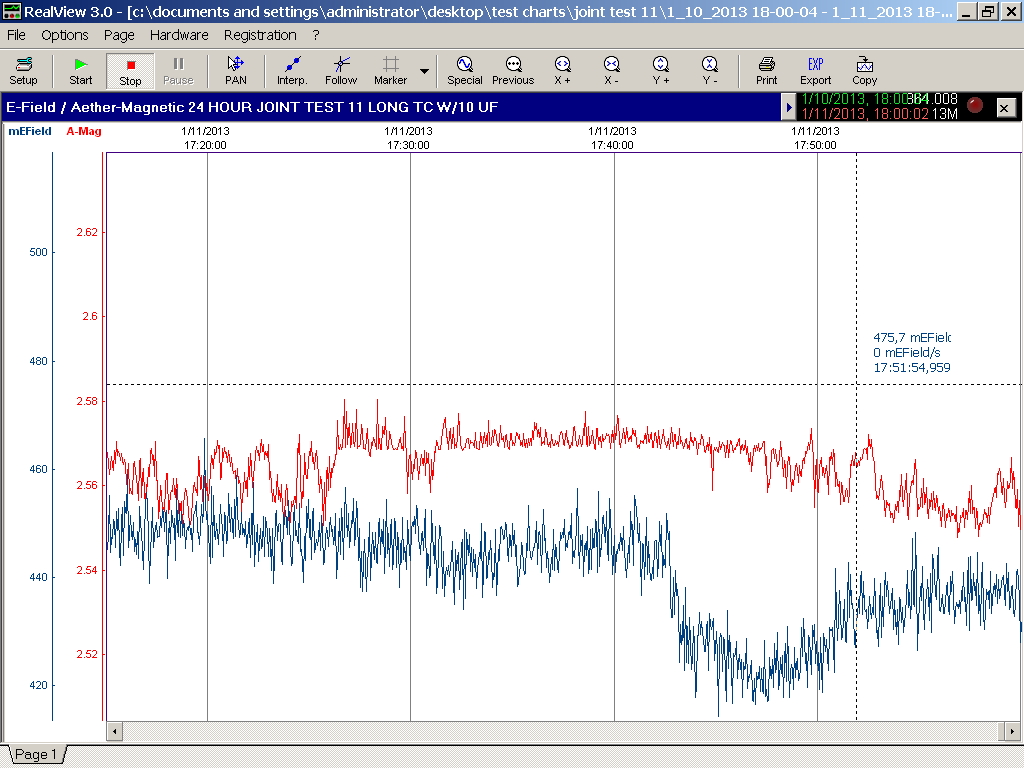
Chart of Lightning
Strikes (UK) \Test 11\Lightning Joint Test 11 Results v2.3.pdf
Note:
On Chart, SC =
Joint
Test 12 2013-01-22 to 23
Sensors
Tested – E-Field & Aether-Magnetic
Circuit’s
used - (Both sensors NOW use Long TC circuit with
10 uF capacitor on output)
E-Field Circuit \Circuits\efield021513.pdf
Aether-Magnetic
Circuit \Circuits\amag021513.pdf
Duration
of Test – 24 hour test
Purpose
of Test – Re-checking for lightning strikes between both of
our locations.
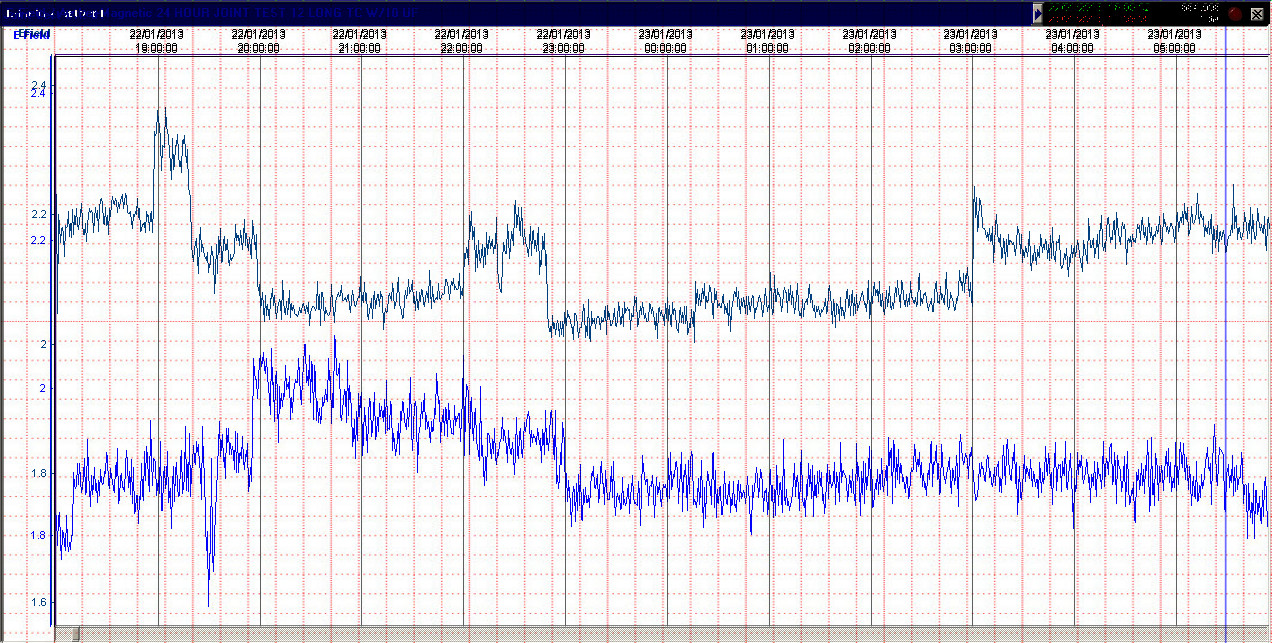
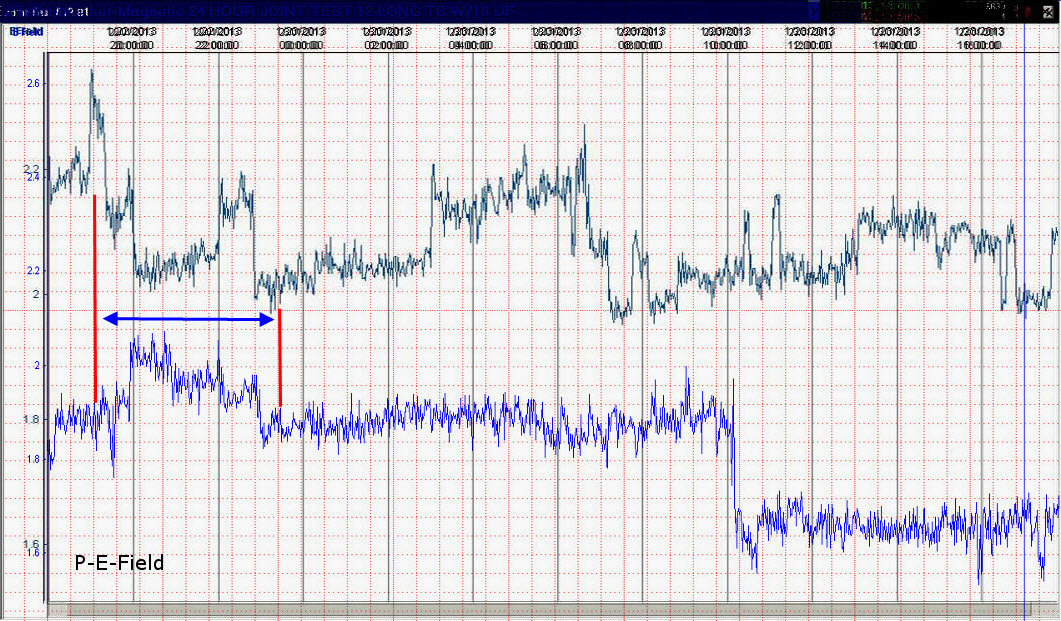
Findings
–
1.
Match ups were found in all the
sensors tested between both of our locations
2.
A 41/2 hour trend was seen in the
E-Field recording between both our locations.
3.
We each checked 2 x 1 hour segments
at our locations and found about 60% matches with the data from the Borders
Weather website
Note
– lightning data only available for
Result
Images
A-Mag Merged\Test
12\T-P-2013-01-22 TO 23 A-MAG.JPG
E-Field Merged\Test
12\T-P-2013-01-22 TO 23 E-FIELD.JPG
California A-Mag
Matches \Test 12\T-P-2013-01-22 TO 23 A-MAG Tmark.JPG
California
E-Field Matches\Test 12\T-P-2013-01-22 TO 23 E-FIELD Tmark.jpg
E-Field 12 Hour
Merge\Test 12\P&T-E-Field 12 hours G.jpg
E-Field 4-1/2
Hour Trend\Test 12\P-T 2013-01-22 to 23 E-Field c.jpg
Note:
The above matches, are events that show up on large time spans. Lightning
matches are usually only seen on charts with a time span of a few minutes.
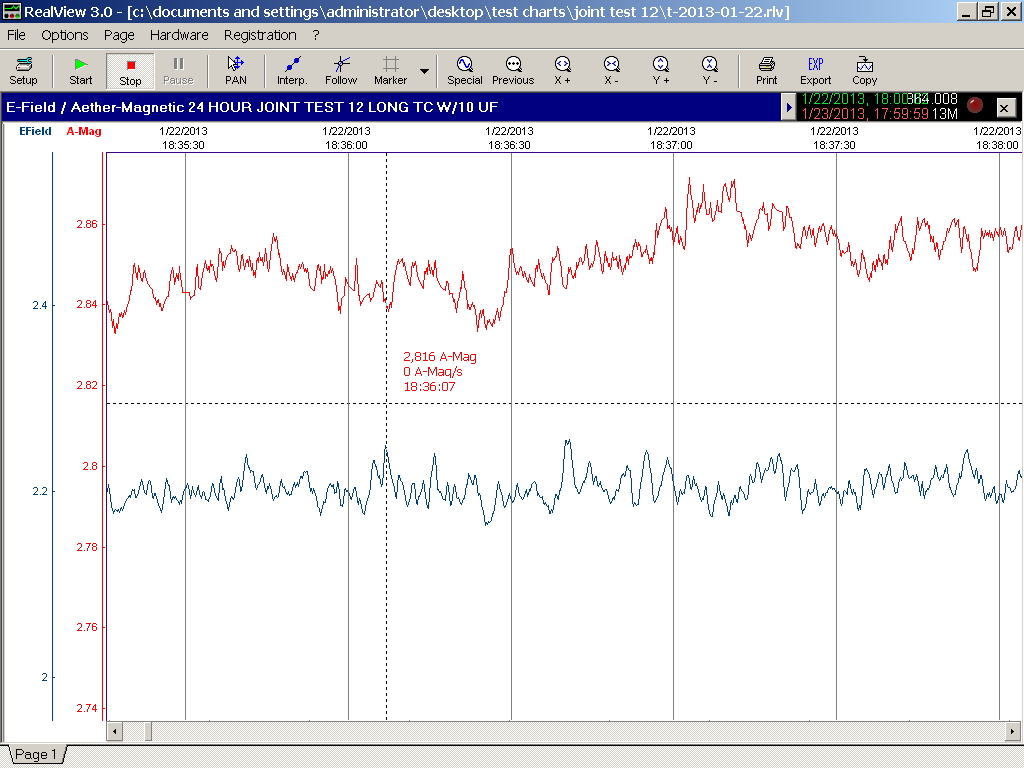
Lightning
Match Examples:
Scotland Example 1\Test
12\P-Lightning Match18-36-07.jpg
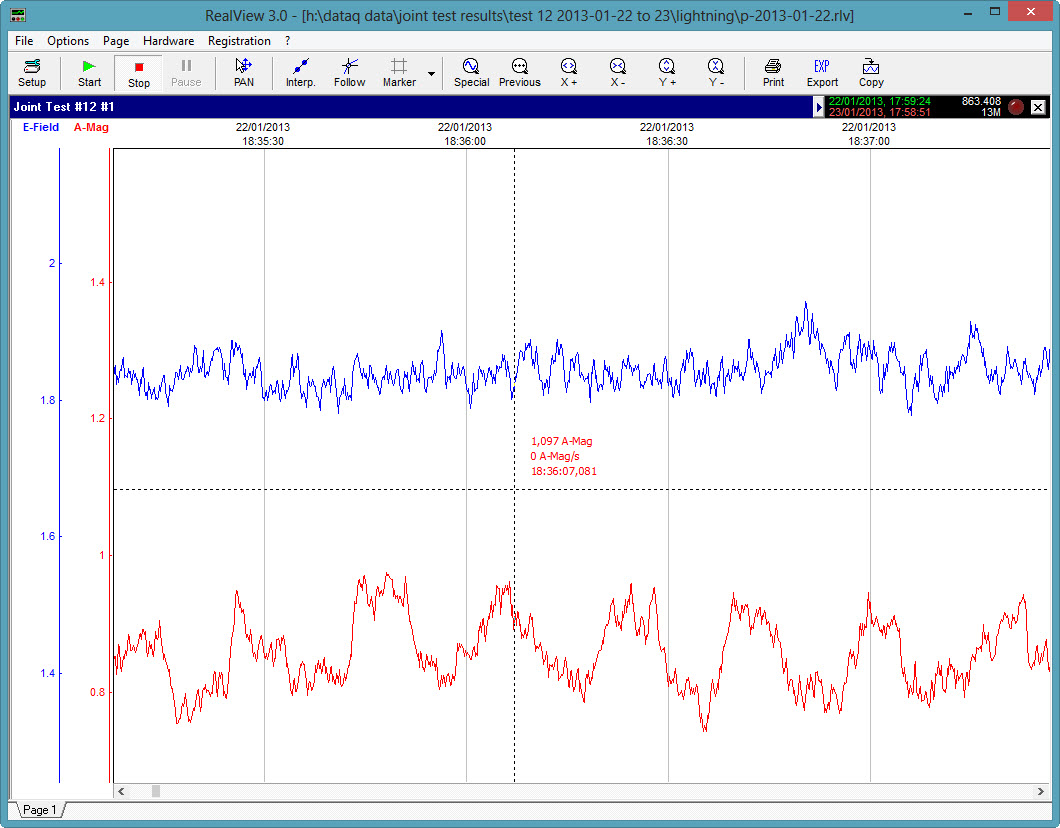
California Example
1\Test 12\T-Lightning Match 18 36 07.jpg
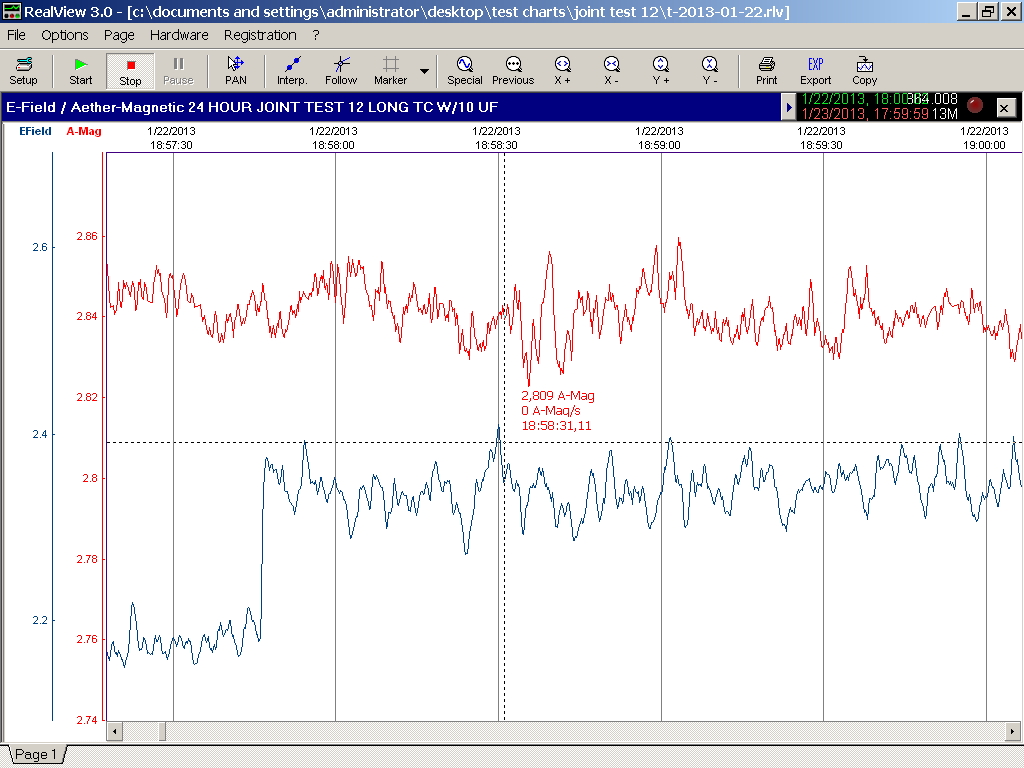
Scotland Example 2\Test
12\P-Lightning Match18-58-31.jpg
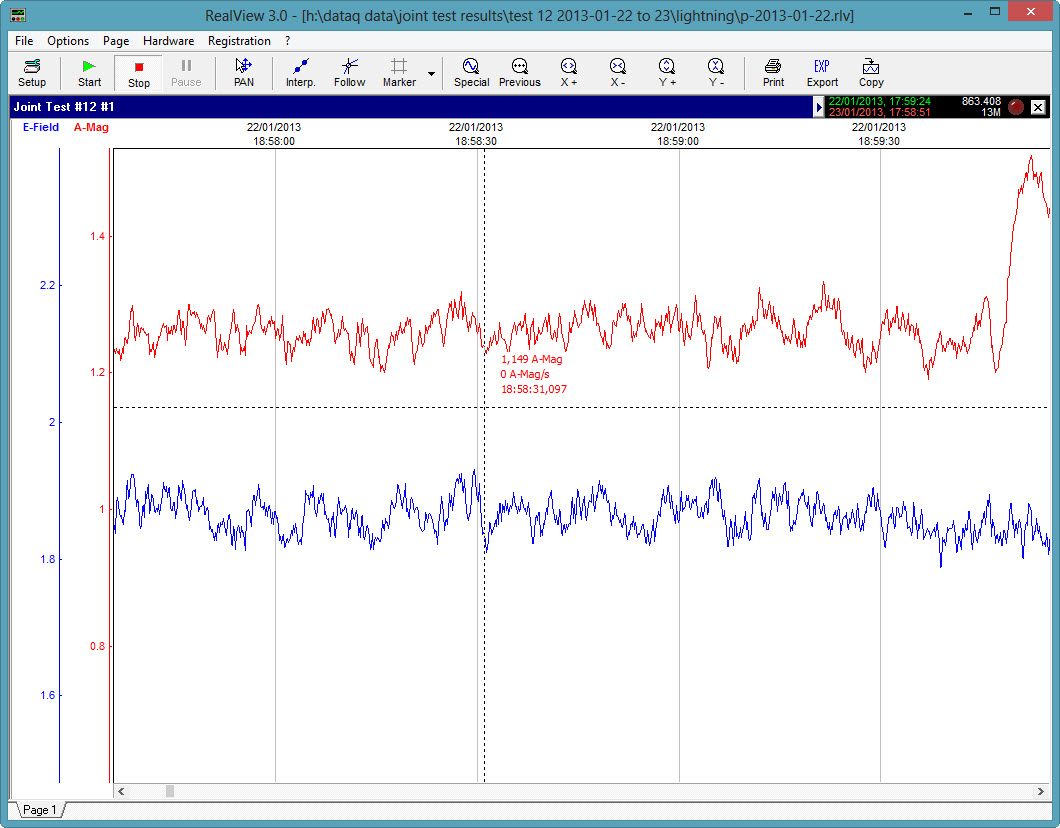
California Example 2\Test
12\T-Lightning Match 18 58 31.jpg
Scotland Example 3\Test
12\P-Lightning Match 20-52-29.jpg
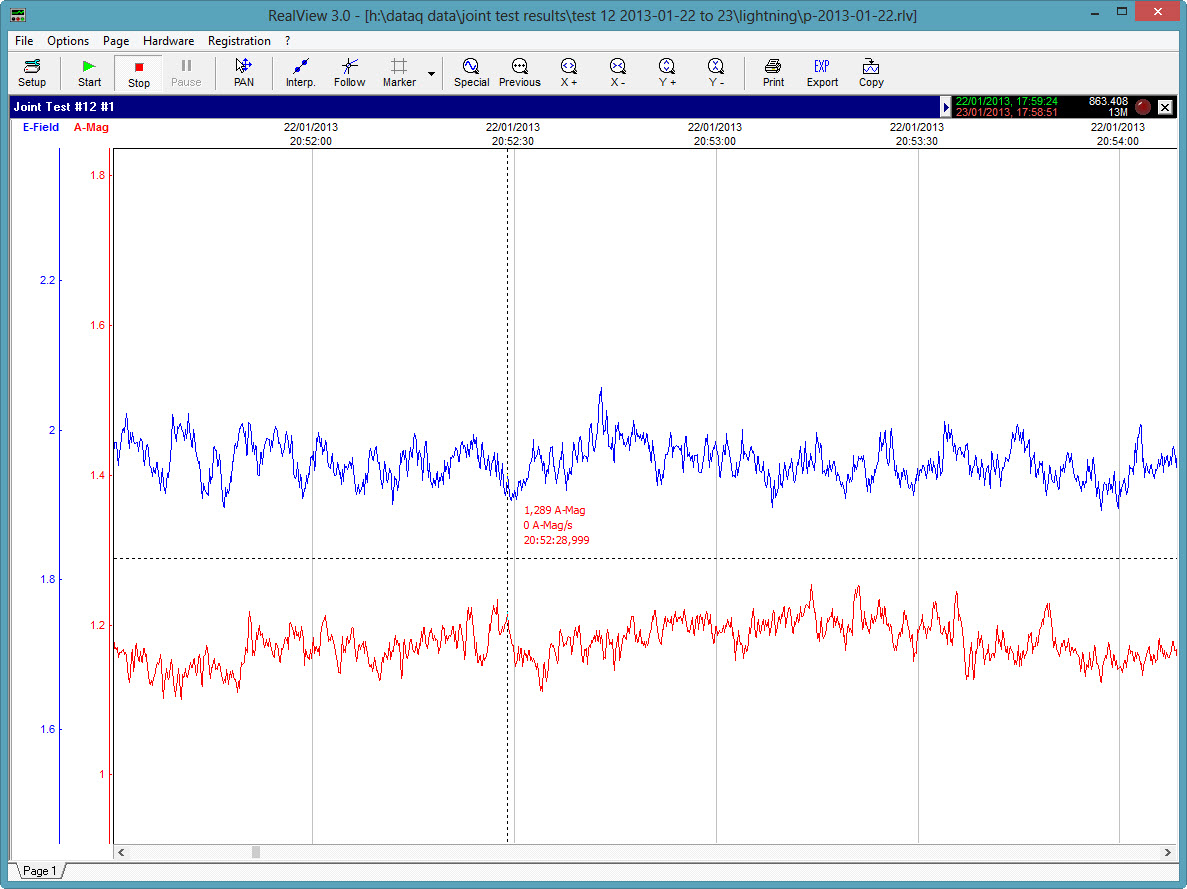
California Example 3\Test
12\T-Lightning Match 20 52 29.jpg
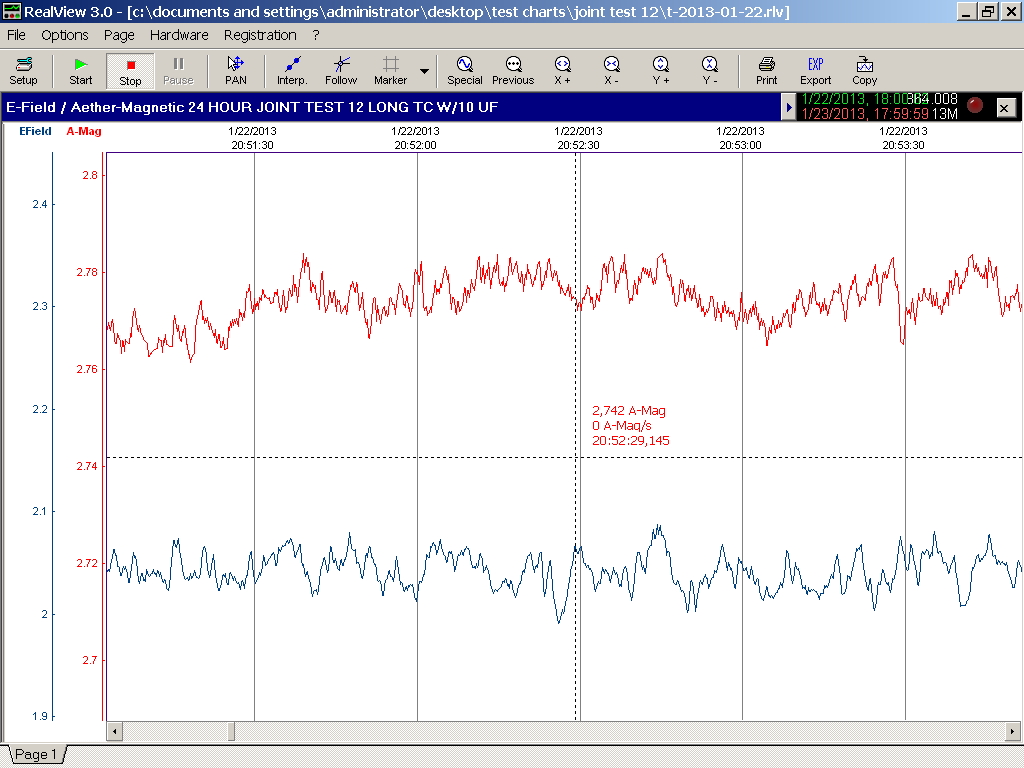
Chart of
Lightning Strikes (UK) \Test 12\T-Lightning Joint Test 12 Results v1.2.pdf
Note:
On Chart, SC =
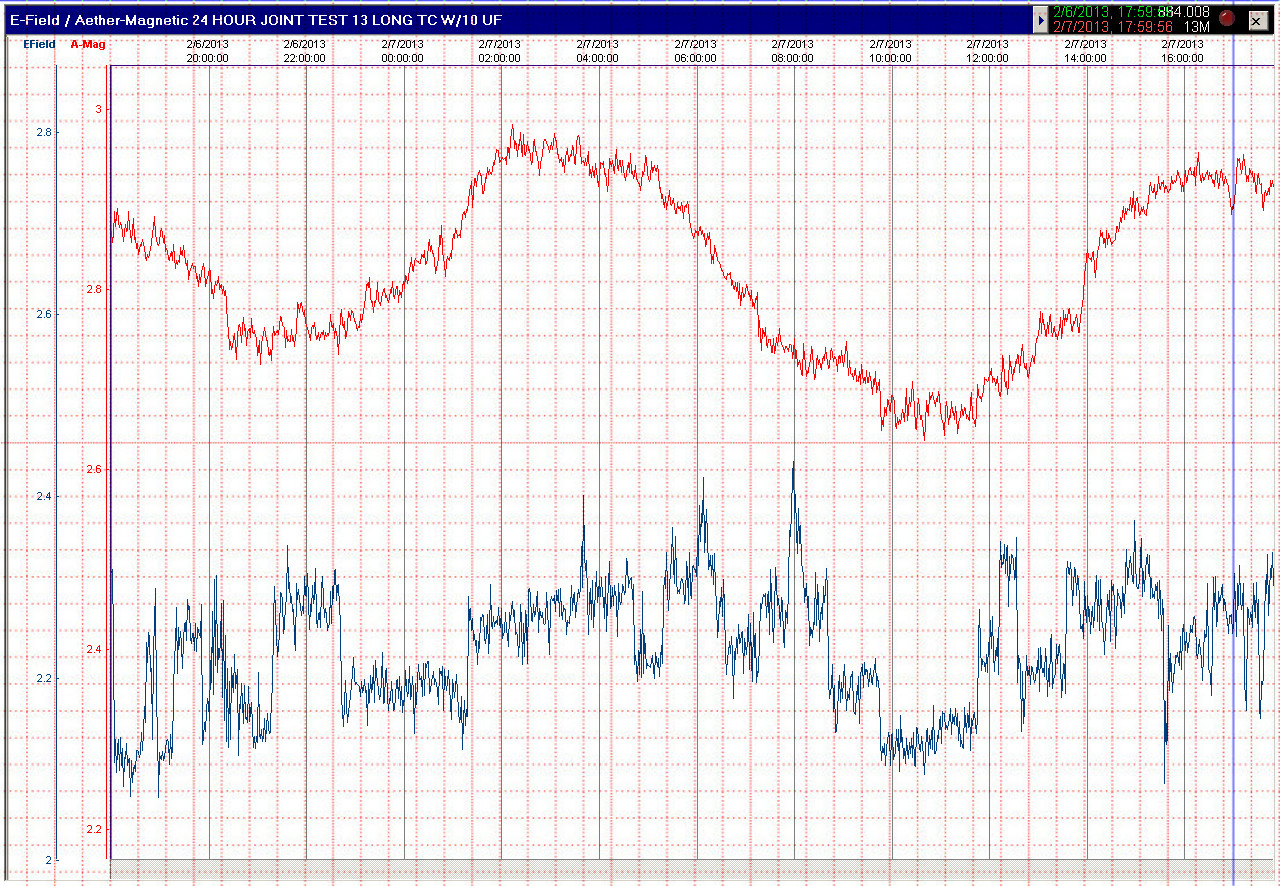
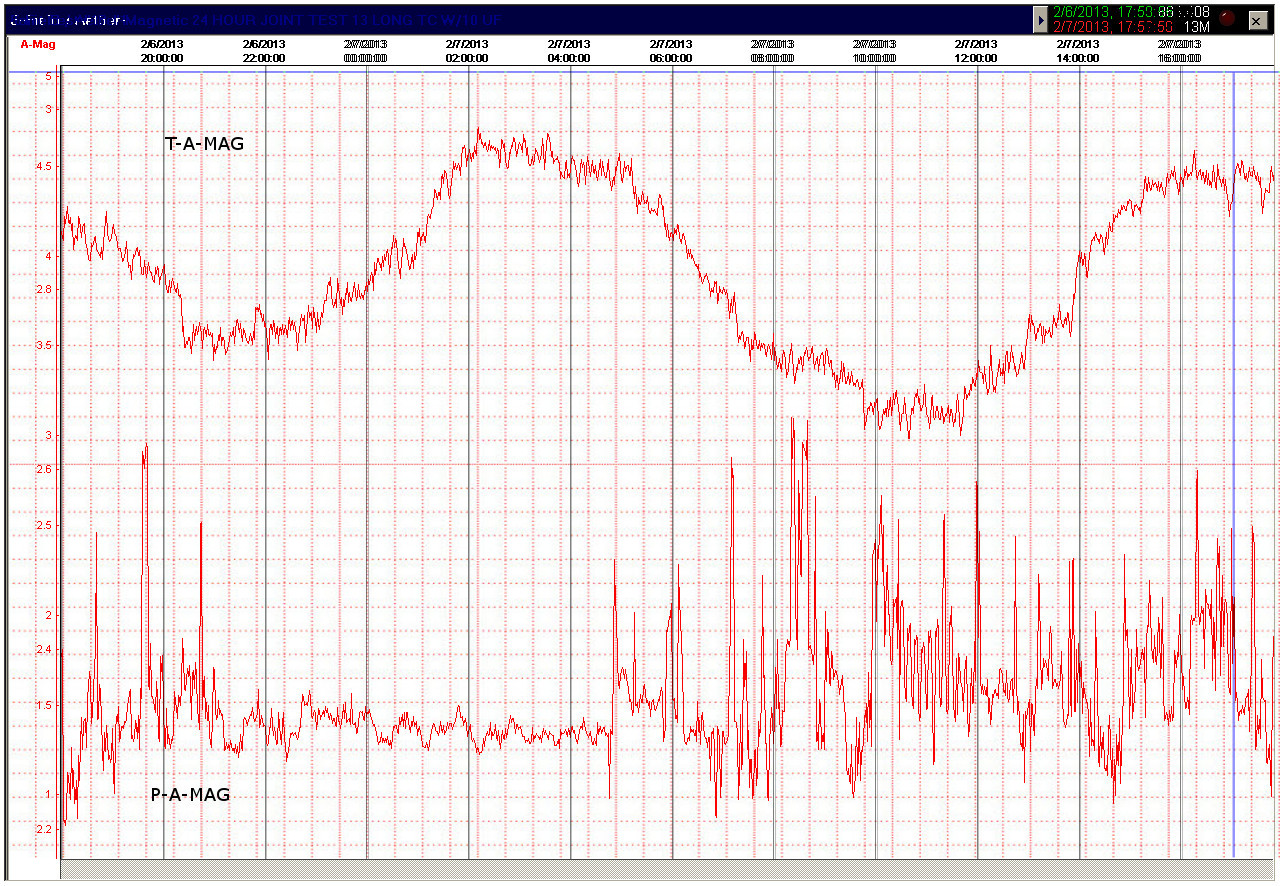
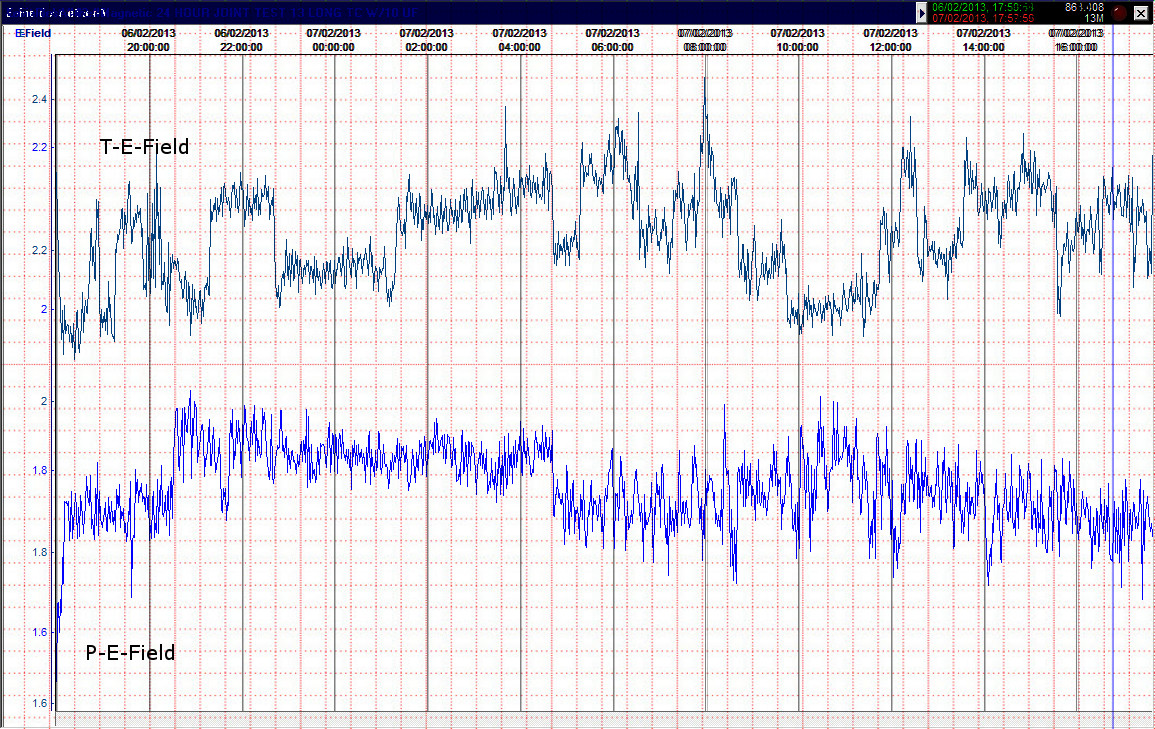
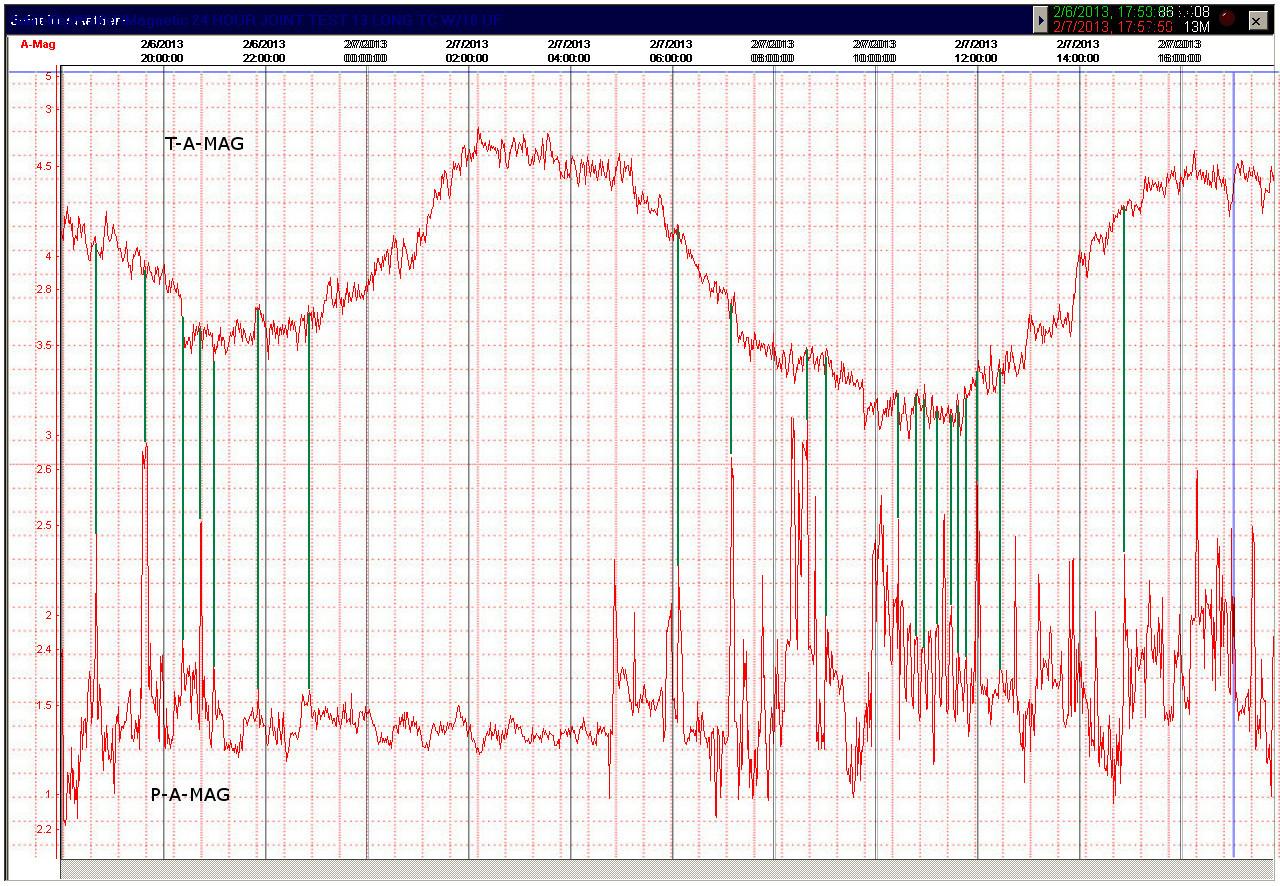
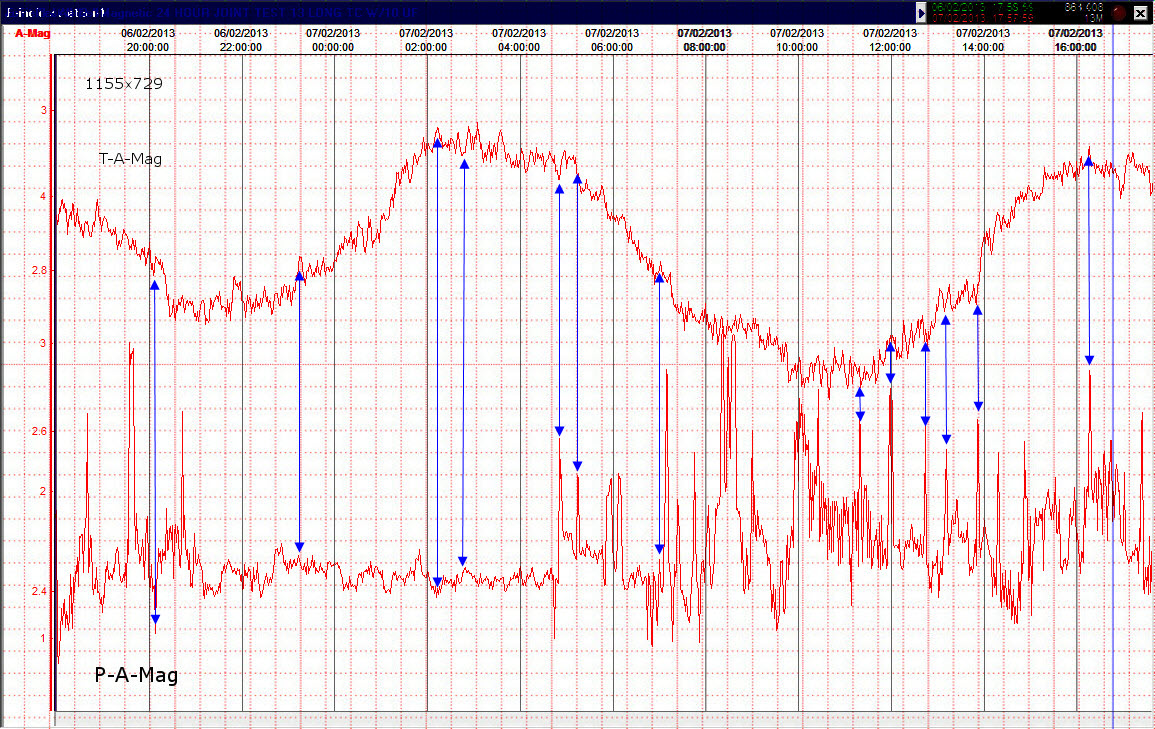
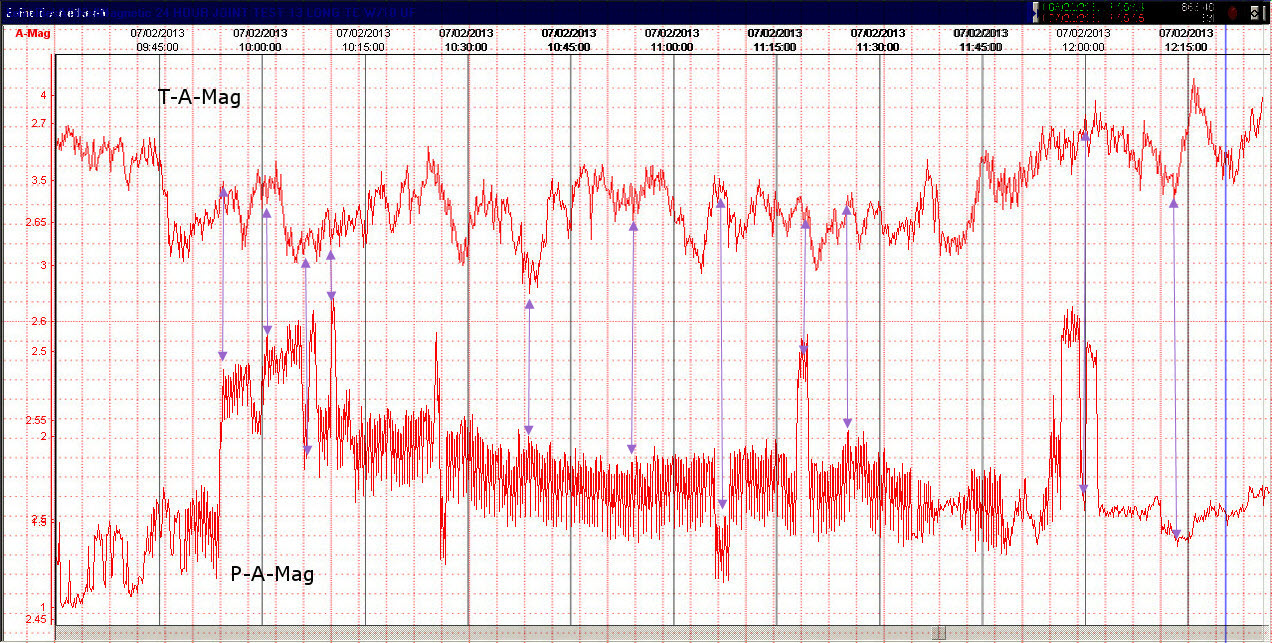
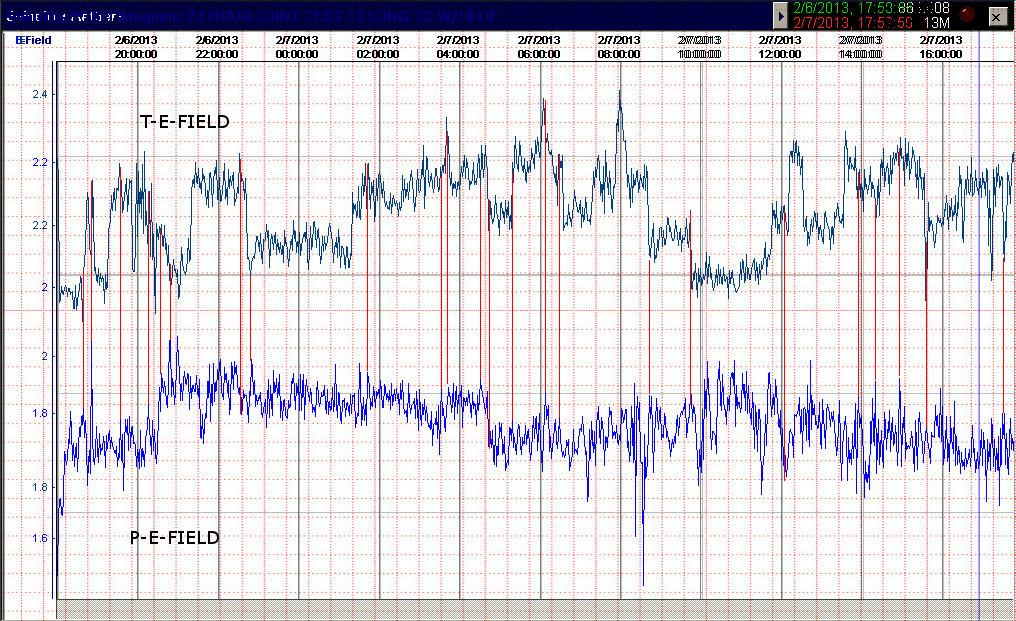
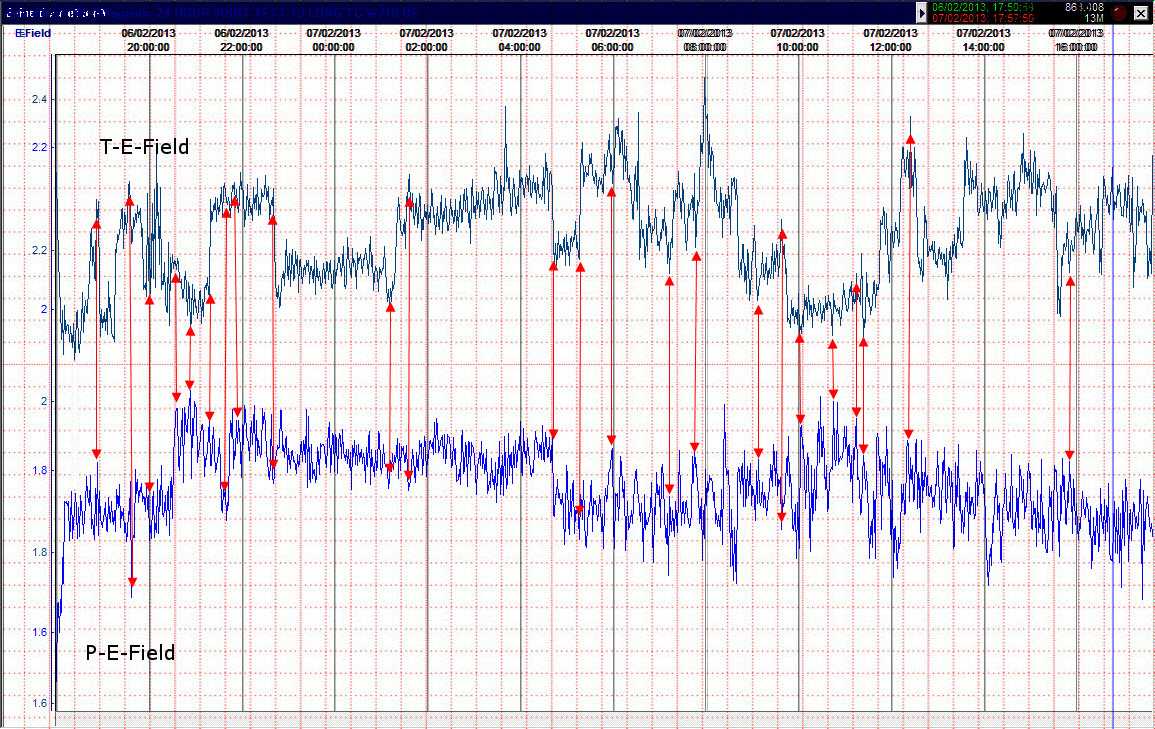
Joint
Test 13 2013-02-06 to 07
Sensors
Tested – E-Field & Aether-Magnetic
Circuit’s
used - (Both sensors NOW use Long TC circuit with 10 uF
capacitor on output)
E-Field Circuit \Circuits\efield021513.pdf
Aether-Magnetic
Circuit \Circuits\amag021513.pdf
Duration
of Test – 24 hour test
Purpose
of Test – This test used higher resolution (1280X1024) images
to find more matches.
Findings
–
1.
Match ups were found in all the
sensors tested between both of our locations
Result
Images
California Both Sensors\Test
13\T-Both-2013-02-06 TO 07.jpg
A-Mag
Merged\Test 13\T&P-JOINT TEST 13-A-MAG-Merg-2013-02-06 TO 07.jpg
E-Field
Merged\Test 13\P&T-Joint Test 13 E-Field 2013-02-06 to 07 c.jpg
California
A-Mag Matches\Test 13\T&P-JOINT TEST 13-A-MAG-MARKS-2013-02-06 TO 07.JPG
Scotland A-Mag
Matches\Test 13\P&T-A-Mag Matches.jpg
Scotland A-Mag
Matches\Test 13\P&T-A-Mag 9-30 to 12-30 marked.jpg
California
E-Field Matches\Test 13\T&P-JOINT TEST 13-E-FIELD-MARKS-2013-02-06 TO
07.JPG
Scotland
E-Field Matches\Test 13\P&T-Joint Test 13 E-Field 2013-02-06 to 07 e.jpg
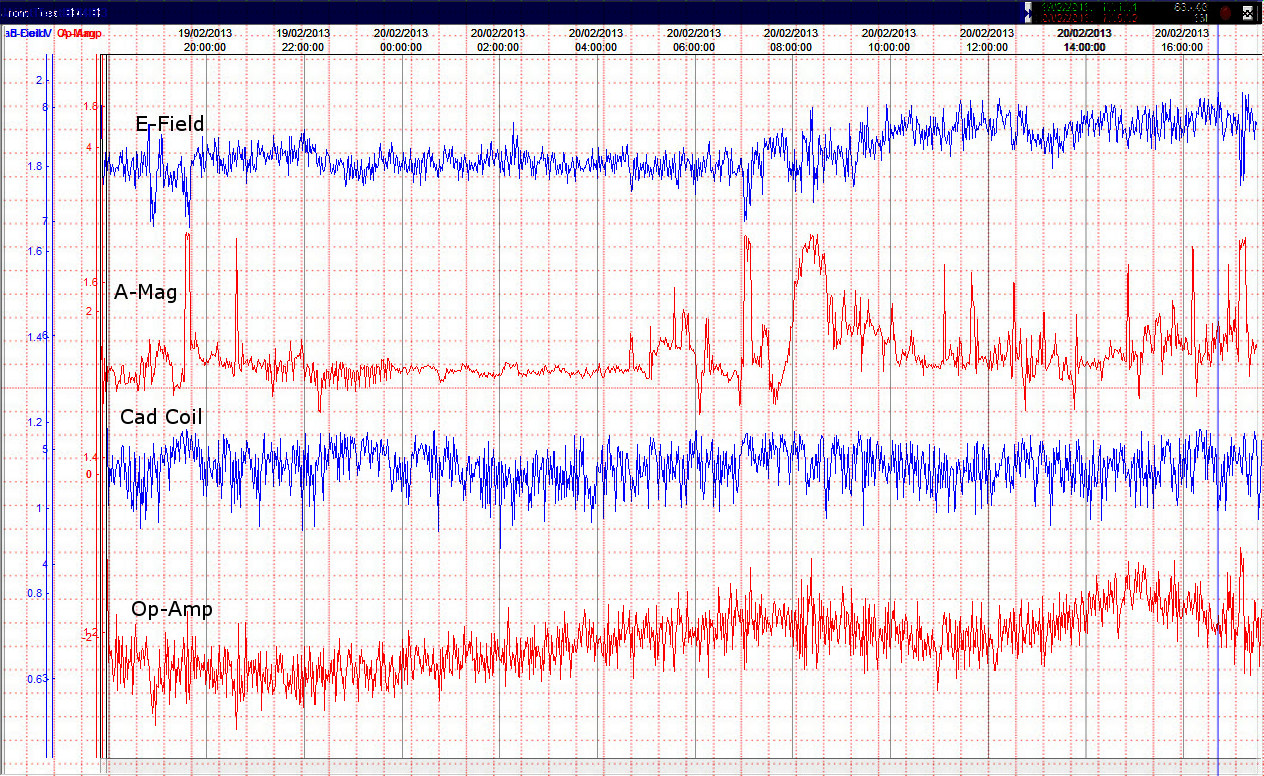
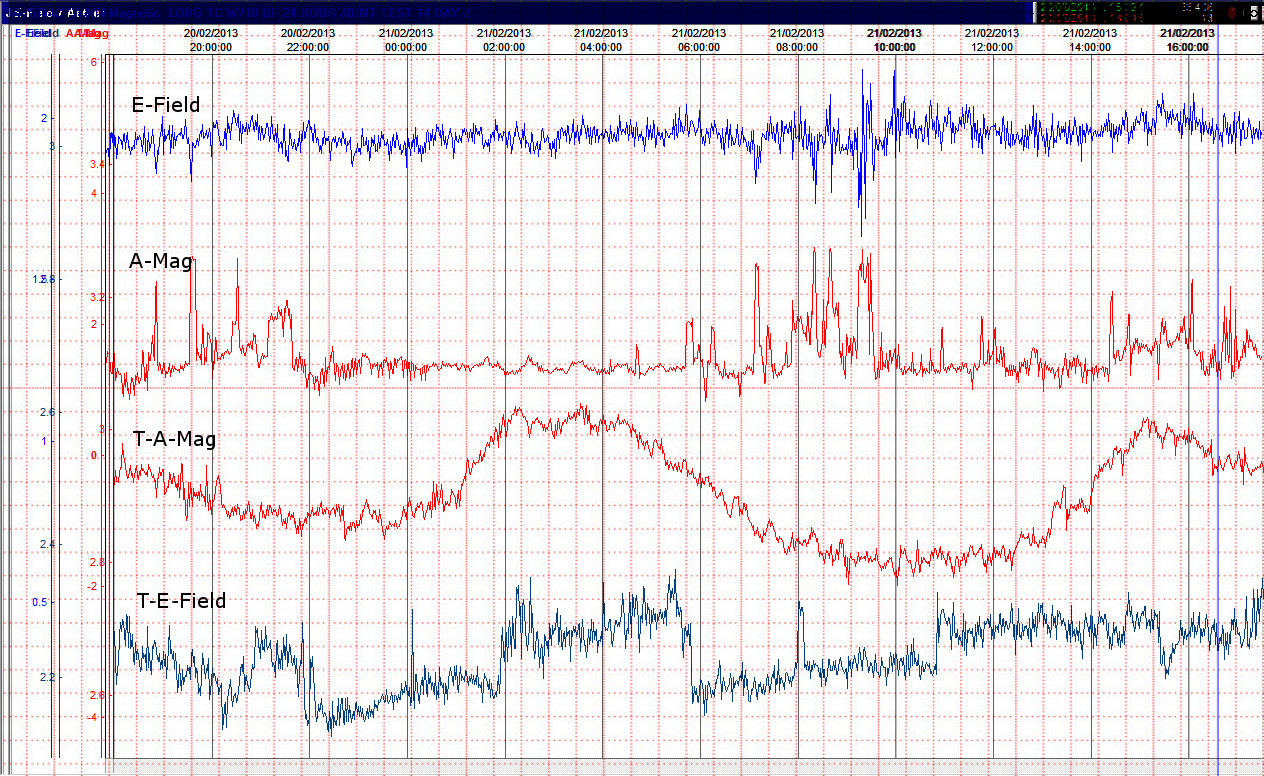
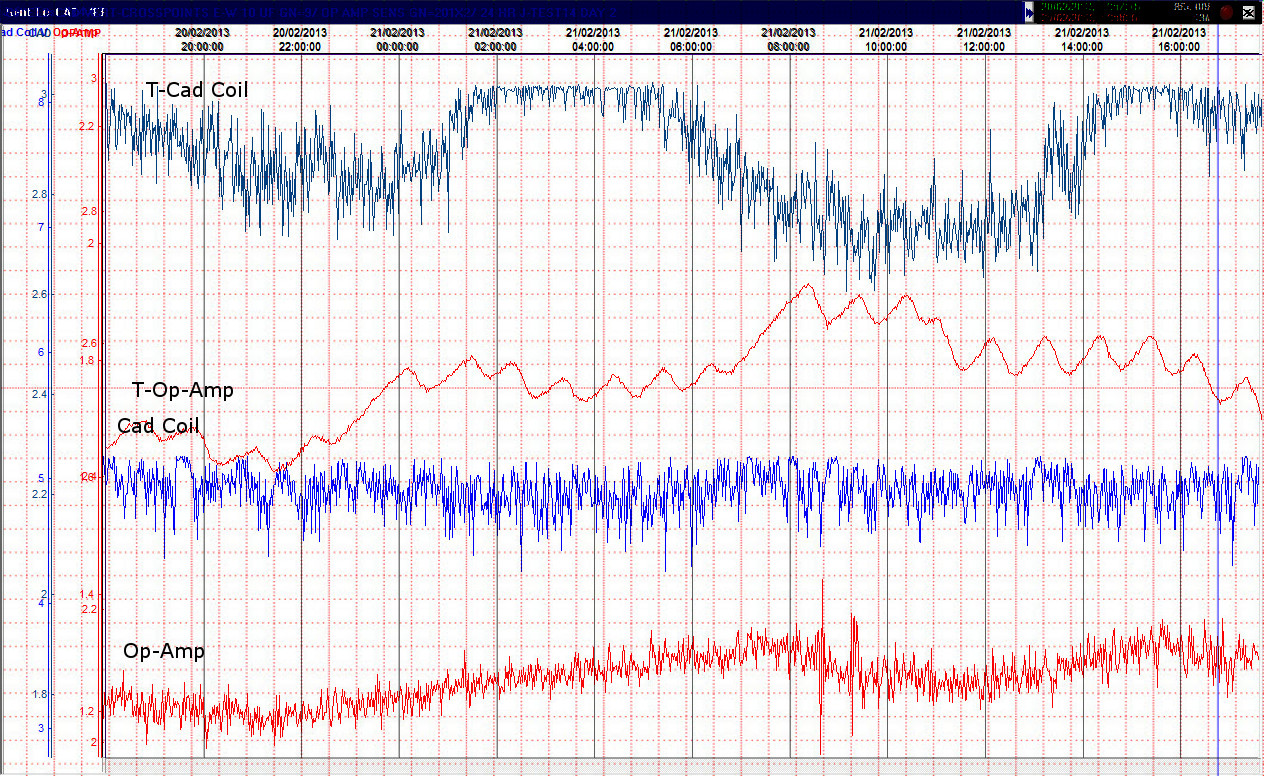
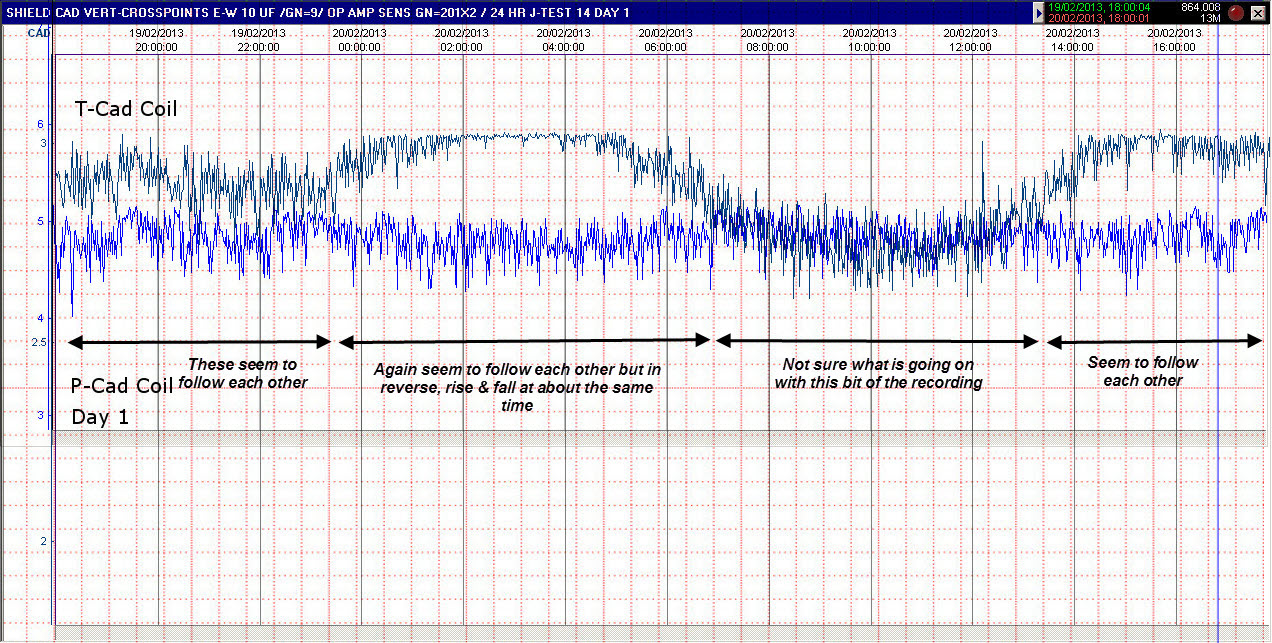
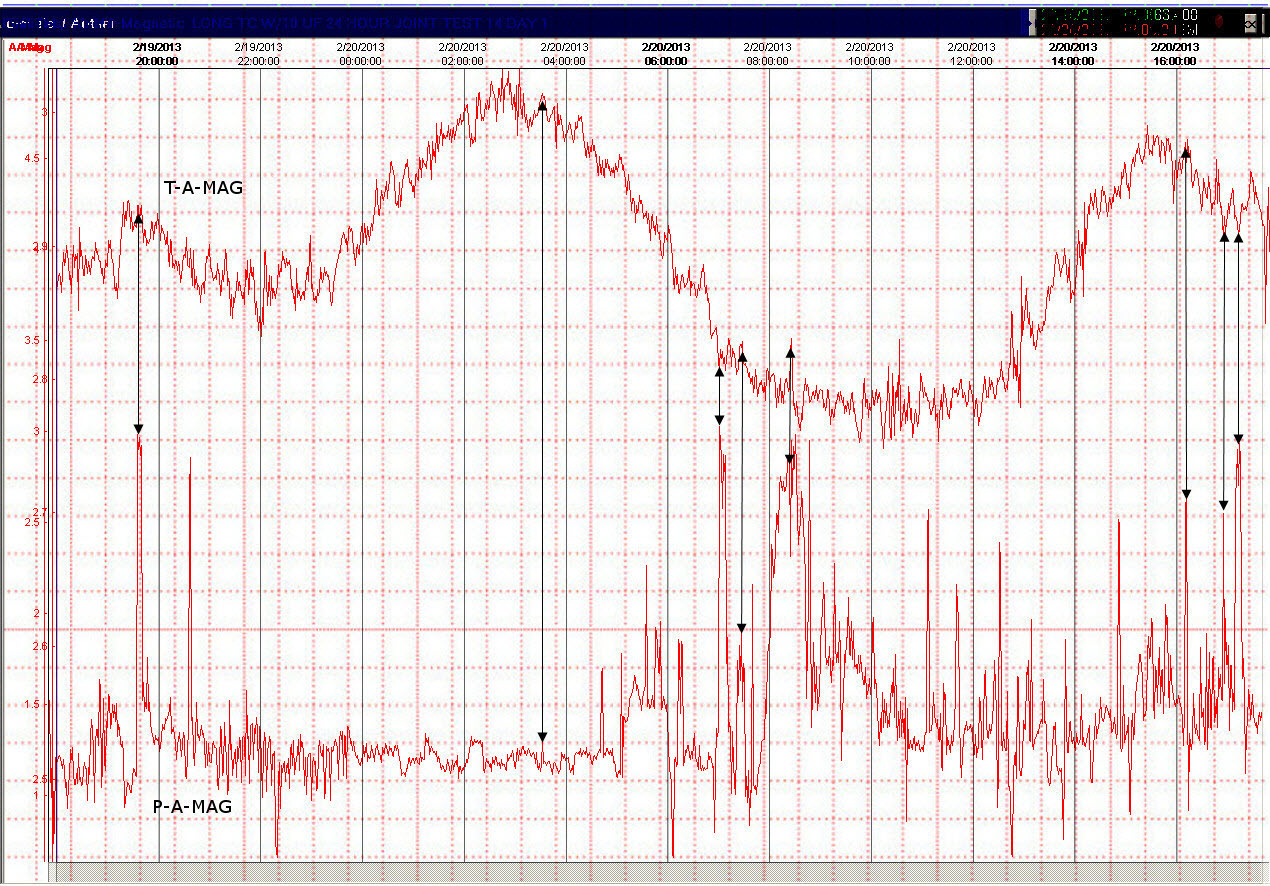
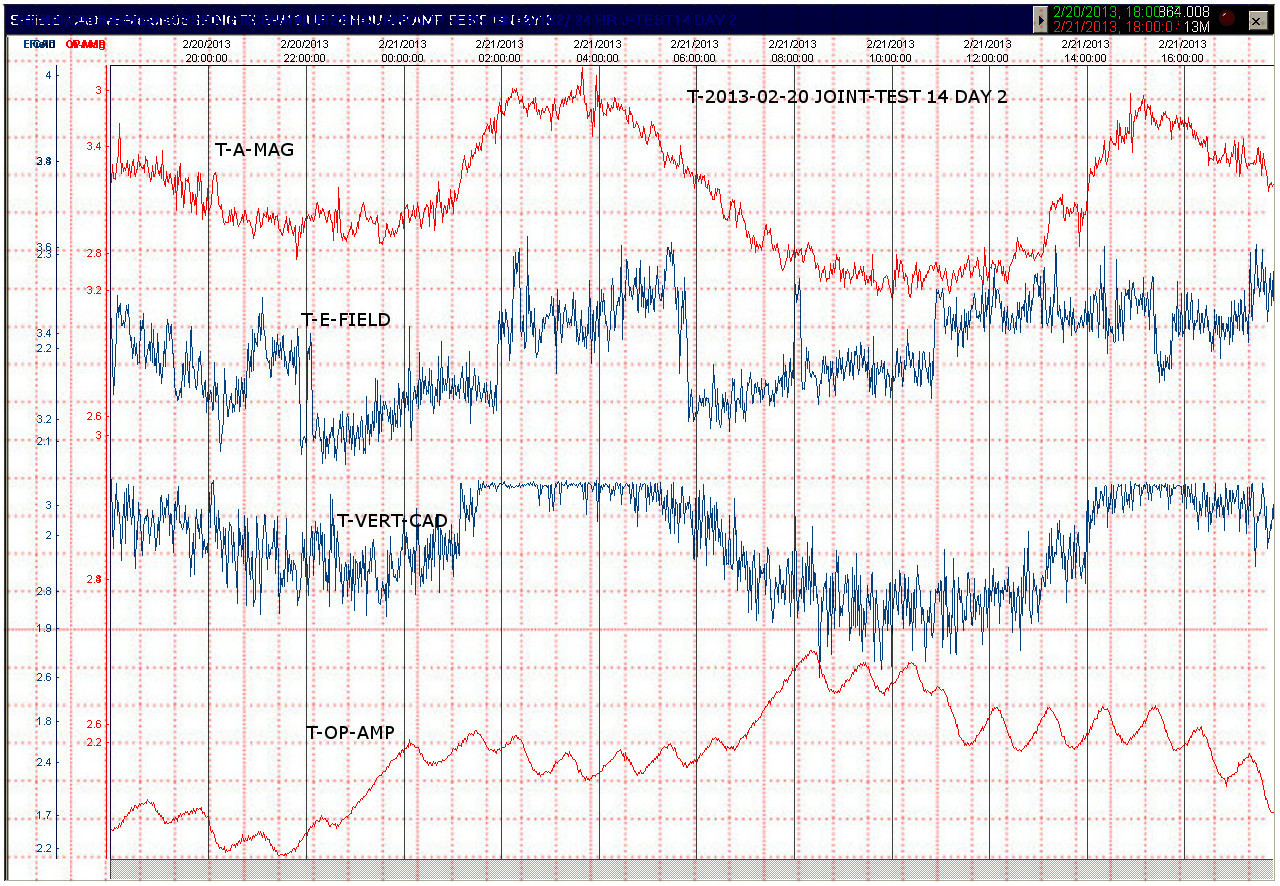
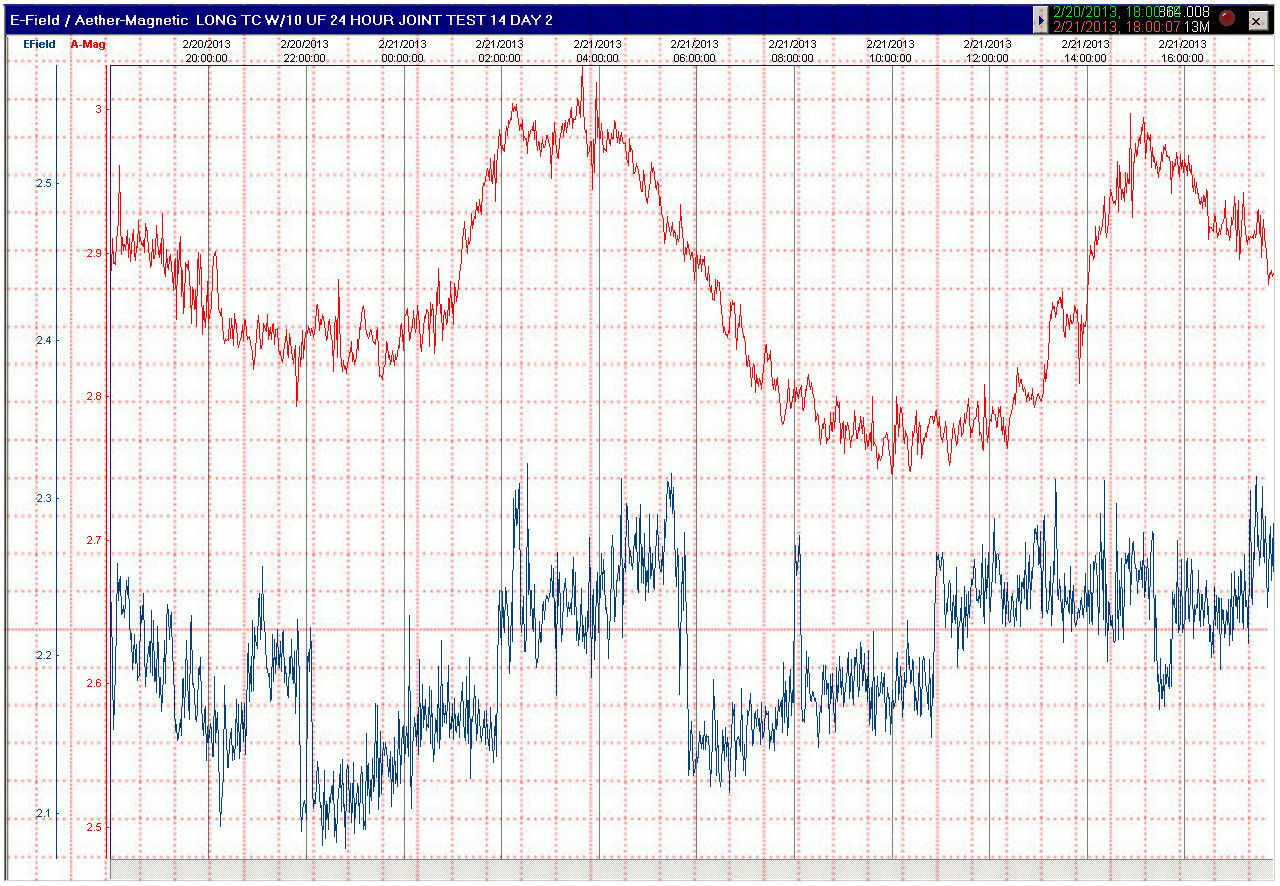
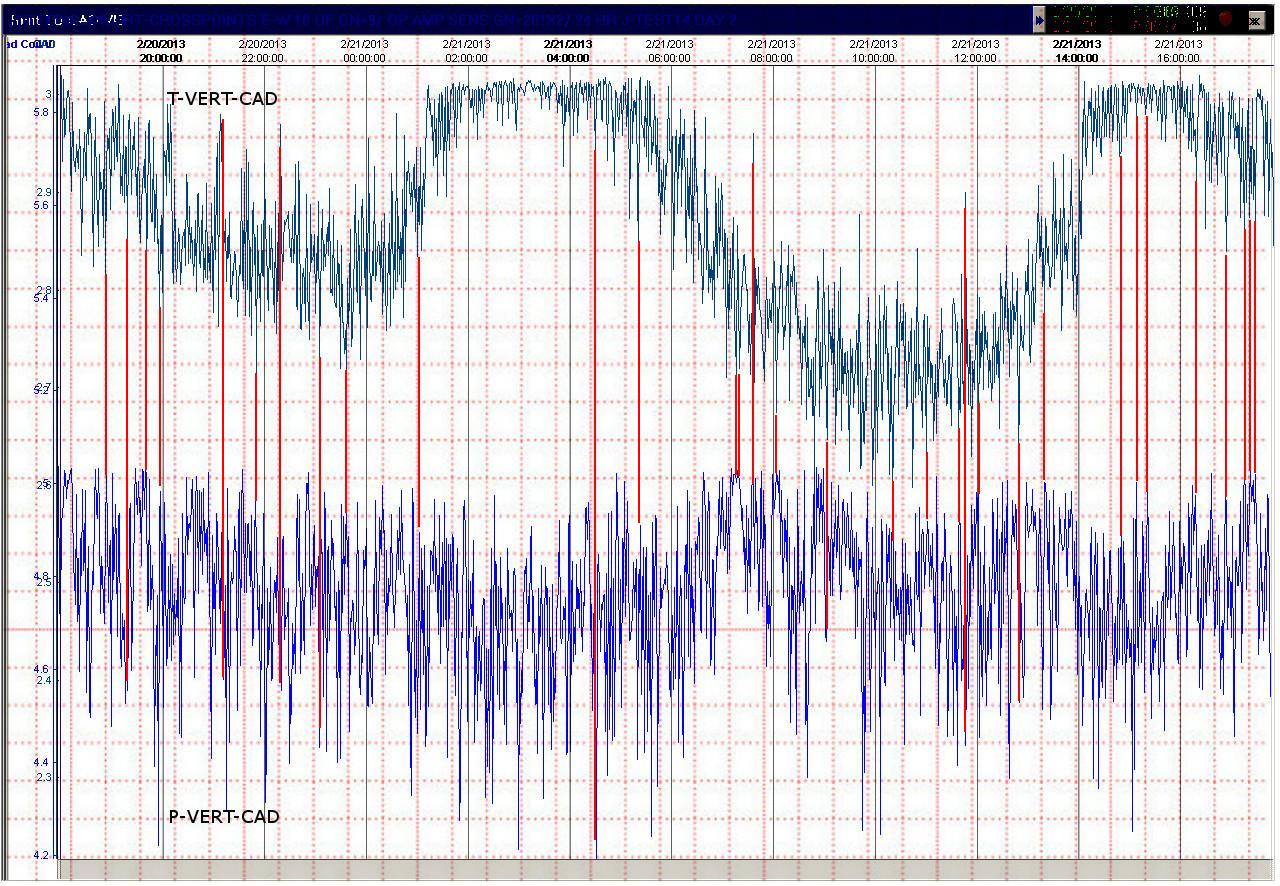
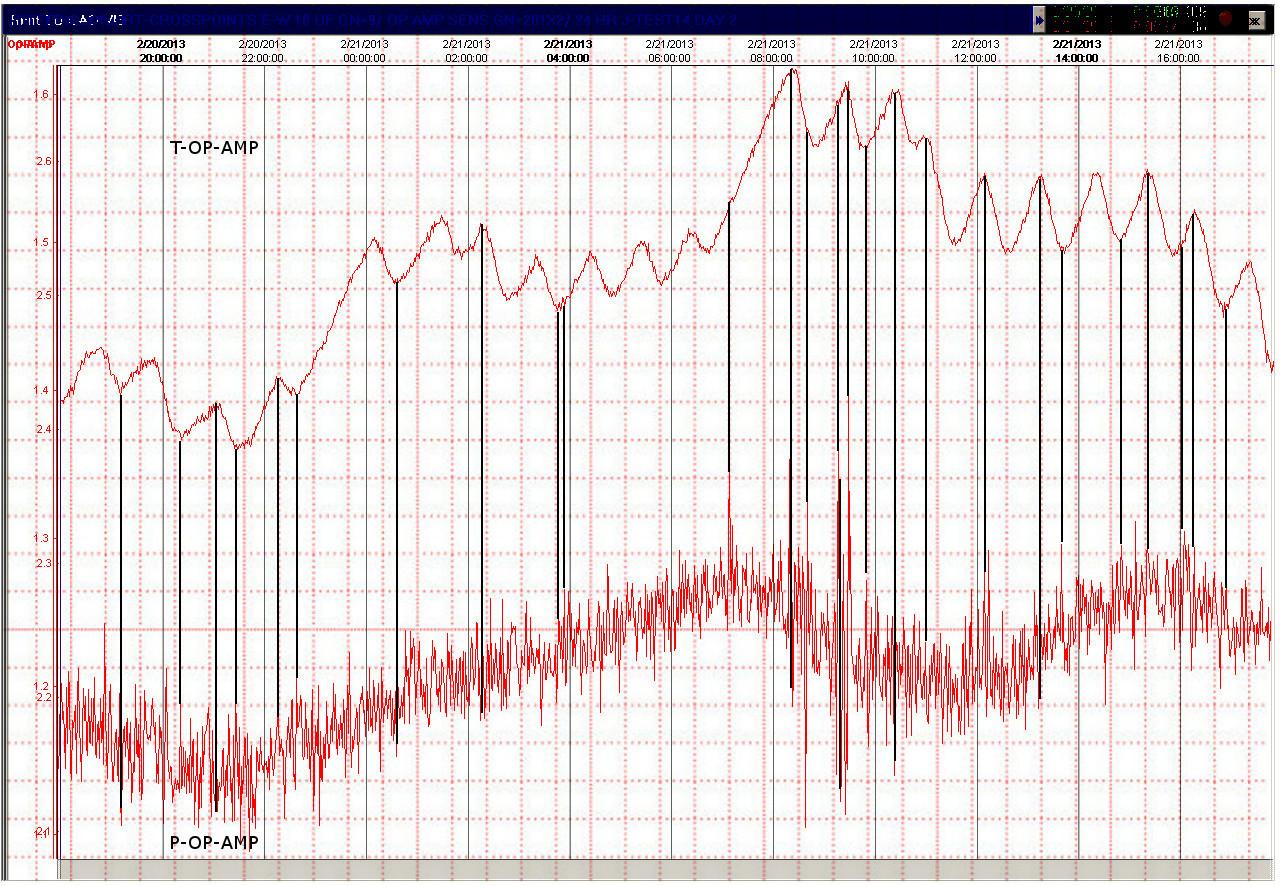
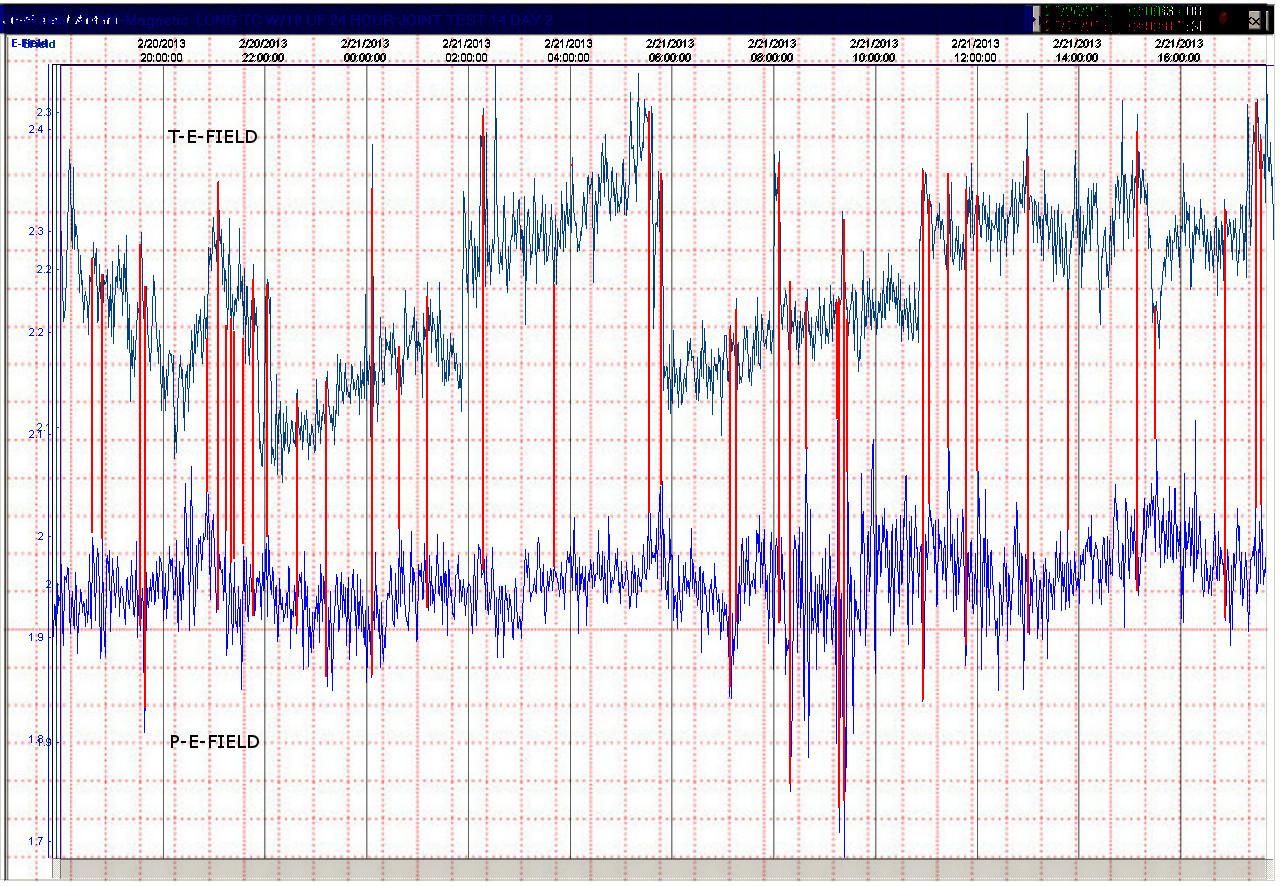
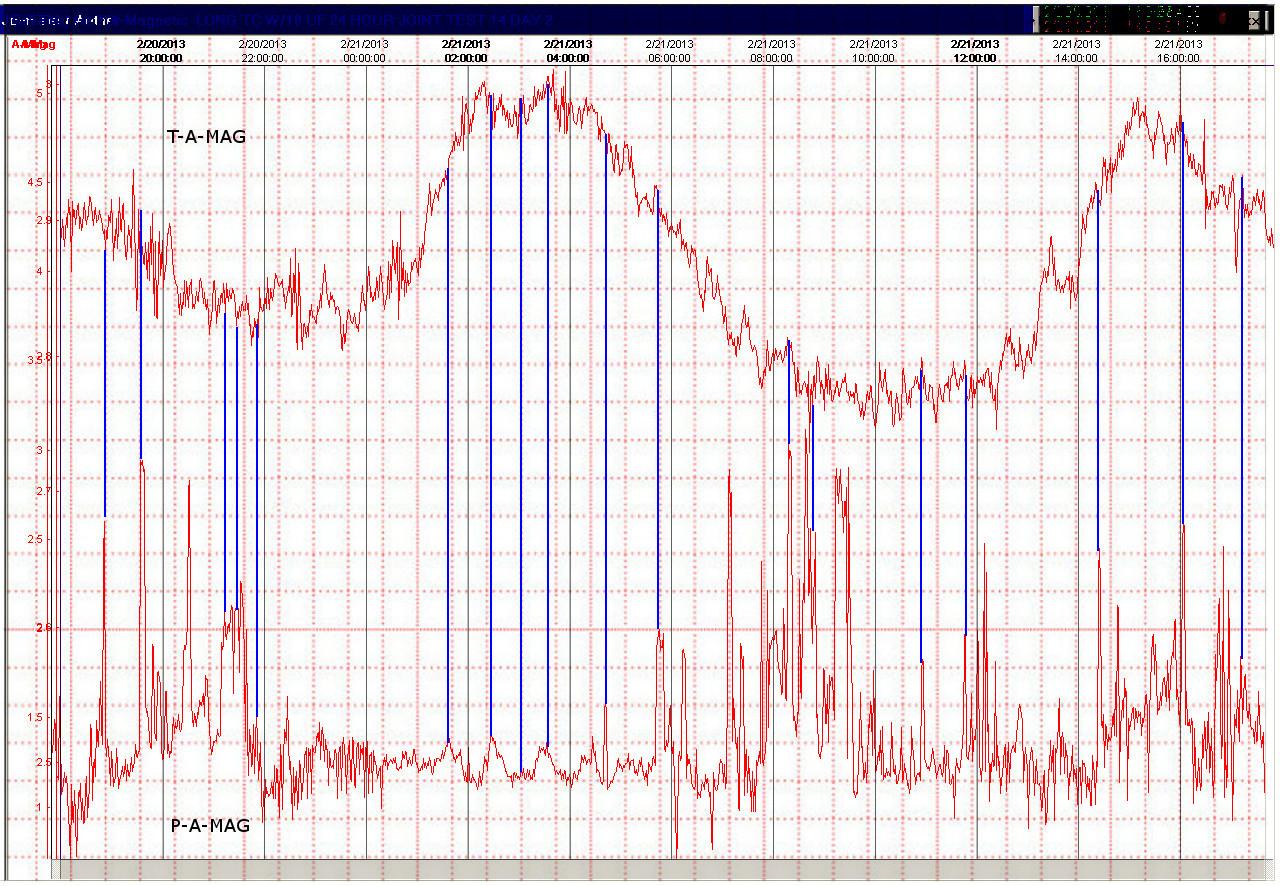
Joint
Test 14 2013-02-19 to 21
Sensors
Tested - E-Field, Aether-Magnetic, Op-Amp & Cad Coil in a
vertical in an East / West position
Circuit’s
used – E-Field, A-Mag, Cad Coil, all use 10 uF on output
now. Op-Amp circuit gain increased. Op-Amp and E-Field circuits, now have a
gain resistor aded to Velleman VM-110 boards.
E-Field Circuit \Circuits\efield021513.pdf
Aether-Magnetic
Circuit \Circuits\amag021513.pdf
Op-Amp Circuit \Circuits\opamp021513.pdf
Caduceus Coil Circuit \Circuits\cad021513.pdf
Duration
of Test – 2 x 24 hour test
Purpose
of Test –
1.
To see if we can see the trend was
saw in Test 13 and test the Op-Amp & Cad Coil sensor and look for match
up’s (spikes) in our recordings.
2.
1000uf capacitor changed to 10uf
capacitor on output of Cad Coil sensor.
Findings
–
1.
Match ups were found in all the
sensors tested between both of our locations.
2.
There was a general trend in Day 2
of the Op-Amp sensor between both of our locations for about ¾ of the
recording.
3.
There was a trend of 2 hours in the
Day 1 E-Field recording
4.
We each chose one day to check for
matches and trends.
Result
Images –
Day
1 -
Scotland-Overview of Recording\Test
14\Day 1\P-2013-02-19-ALL-SENSORS-GR.jpg
Scotland and California E-Field and A-Mag Sensors.Test 14 Day 1.jpg
California and Scotland Op-Amp and Cad-Coil Sensors Test 14 Day 1.jpg
Cad
Coil Trend\Test 14\Day 1\P&T-Day 1 Cad Coil 2 G Marked.jpg
Cad Coil
Matches\Test 14\Day 1\P&T-Day 1 Cad Coil G Marked.jpg
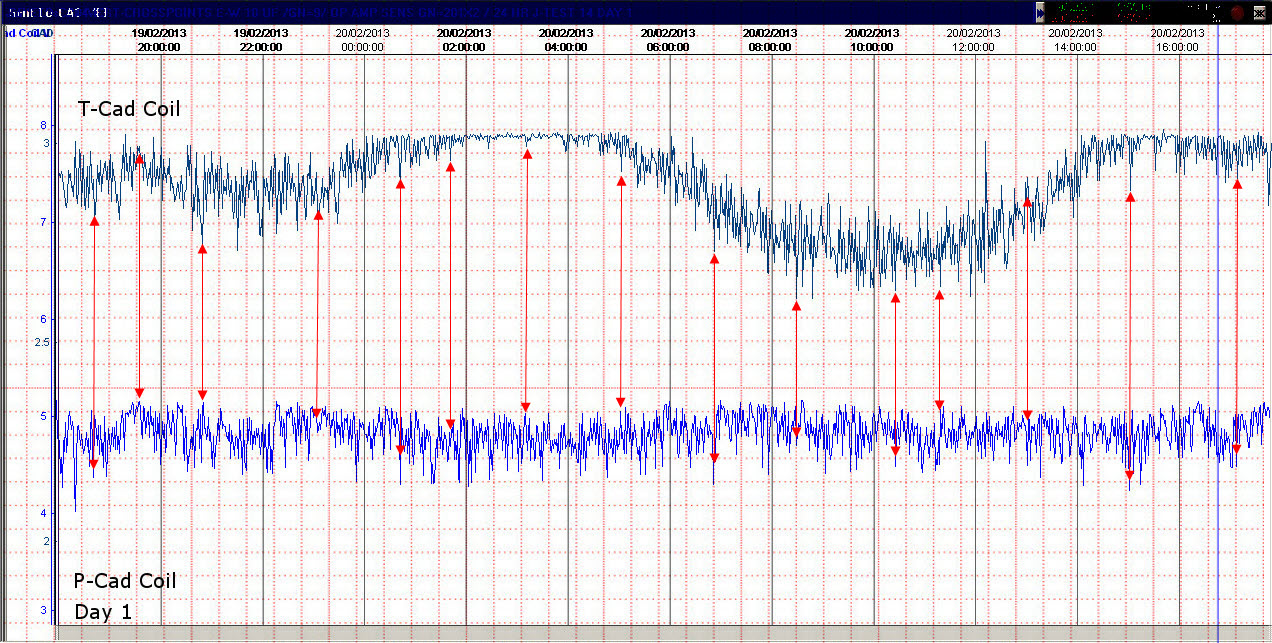
Op-Amp
Matches\Test 14\Day 1\P&T-Day 1 Op-Amp G Marked.jpg
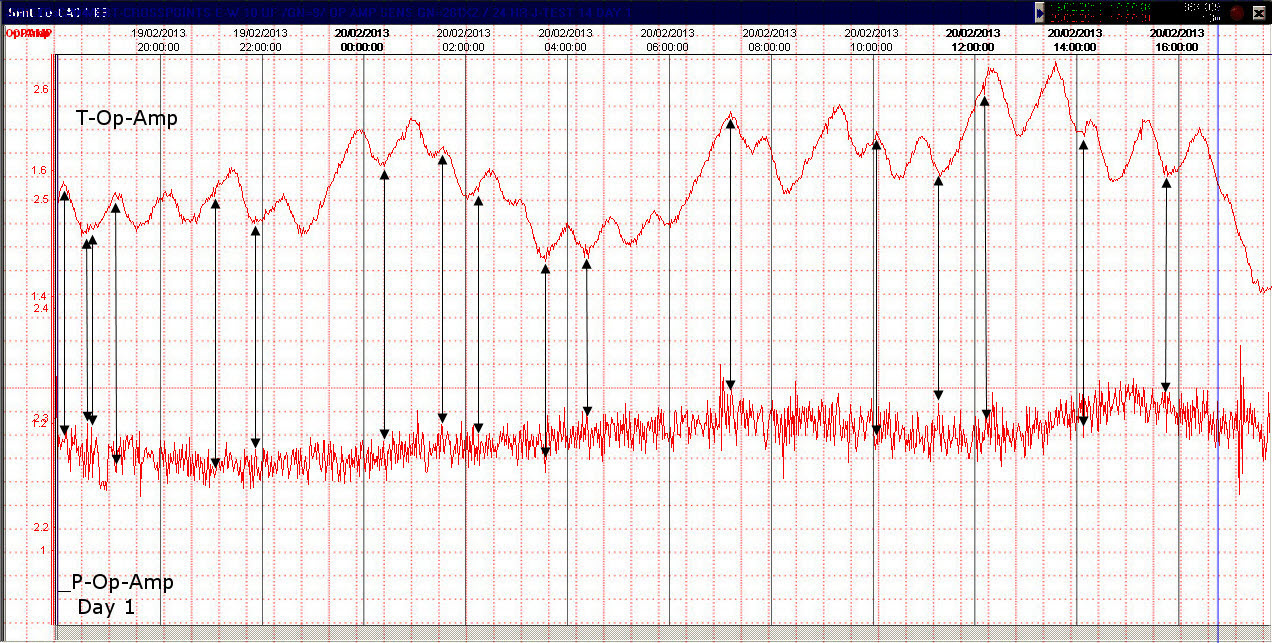
E-Field
with 2 Hr Trend\Test 14\Day
1\T-P-2013-02-19-JOINT-TEST-14-E-FIELDMERGE-GR-Marked.jpg
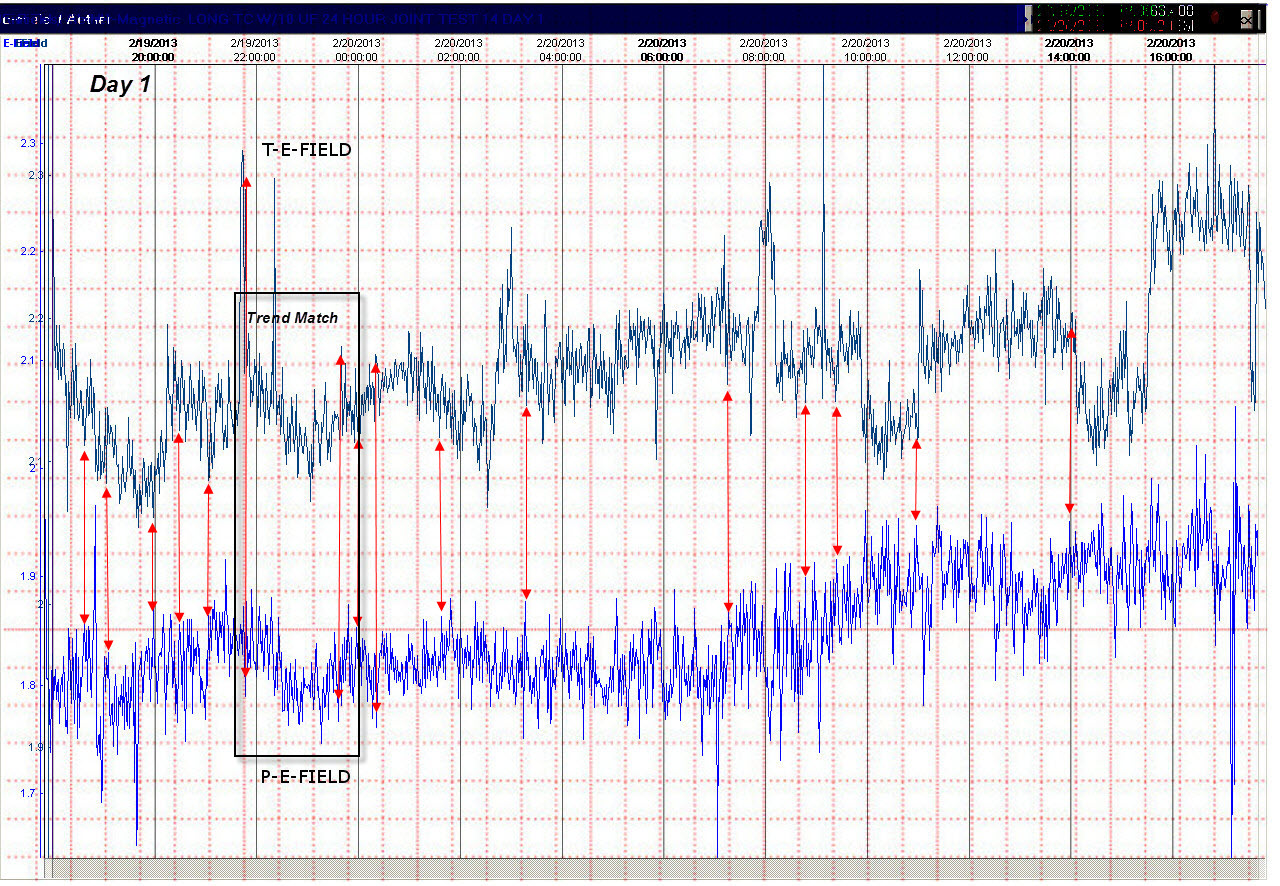
A-Mag
Matches\Test 14\Day 1\T-P-2013-02-19-JOINT-TEST-14-A-MAG MERGE-GR-Marked.jpg
Day
2 -
California-Overview of Recording\Test
14\Day 2\T-2013-02-20-ALL-SENSORS-GR.jpg
A-Mag and E-Field
Day 2\Test 14\Day 2\T-2013-02-20-A-MAG-E-FIELD-GR.jpg
Cad Coil and Op-Amp Day
2\Test 14\Day 2\T-2013-02-20-CAD-OP-AMP-GR.jpg
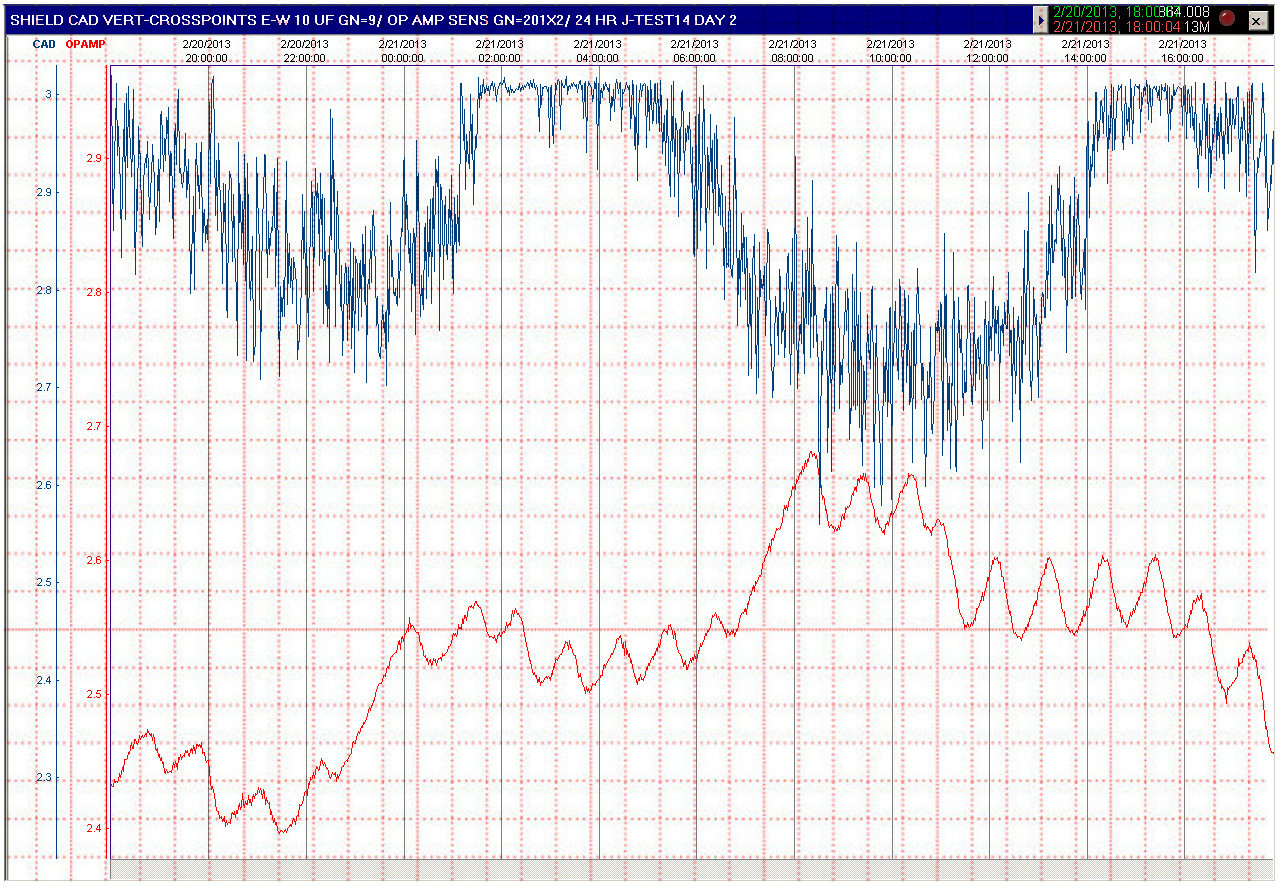
Cad
Coil Matches\Test 14\Day 2\T-P-2013-02-20-JOINT-TEST-14-V-CAD MERGE-MARKED.jpg
Op-Amp
Matches\Test 14\Day 2\T-P-2013-02-20-JOINT-TEST-14-OP-AMP MERGE-MARKED.JPG
E-Field
Matches\Test 14\Day 2\T-P-2013-02-20-JOINT-TEST-14-E-FIELD MERGE-MARKED.JPG
A-Mag
Matches\Test 14\Day 2\T-P-2013-02-20-JOINT-TEST-14-A-MAG MERGE-MARKED.JPG
2012-2013 Theory and Sensor Details